GENEVA – The International Air Transport Association (IATA) announced that the strong post-pandemic passenger traffic trend continued in August.
Total traffic in August 2023 (measured in revenue passenger kilometers or RPKs) rose 28.4% compared to August 2022. Globally, traffic is now at 95.7% of pre-COVID levels.
Domestic traffic for August rose 25.4% versus August 2022 and was 9.2% above the August 2019 results. This is largely driven by Chinese domestic demand.
International traffic climbed 30.4% compared to the same month a year ago. All markets saw double-digit percentage gains year on year. International RPKs reached 88.5% of August 2019 levels.
“Demand for air travel performed well in August. For the year to date, international traffic has increased by 50% versus last year and ticket sales data show international bookings strengthening for travel in the last part of the year,” said Willie Walsh, IATA’s Director General.
Air passenger market in detail

(*1) % of industry RPKs in 2022 – (*2) Change in load factor – (*3) Load factor level
International passenger markets
Asia-Pacific airlines saw a 98.5% increase in August 2023 traffic compared to August 2022, continuing to lead the regions. Capacity climbed 85.5% and the load factor increased by 5.5 percentage points to 84.2%.
European carriers’ August traffic rose 13.6% versus August 2022. Capacity increased 12.3%, and load factor edged up 1.1 percentage points to 86.8%.
Middle Eastern airlines posted a 27.3% increase in August traffic compared to a year ago. Capacity rose 22.7% and load factor climbed 3.0 percentage points to 83.1%.
North American carriers had an 18.6% traffic rise in August 2023 versus the 2022 period. Capacity increased 17.5%, and load factor improved 0.8 percentage points to 87.7%, which was the highest among the regions for a third consecutive month.
Latin American airlines’ traffic rose 26.4% compared to the same month in 2022. August capacity climbed 23.8% and load factor rose 1.7 percentage points to 86.1%.
African airlines saw a 26.1% traffic increase in August 2023 versus a year ago. August capacity was up 25.5% and load factor rose 0.4 percentage points to 76.2%.
Domestic passenger markets

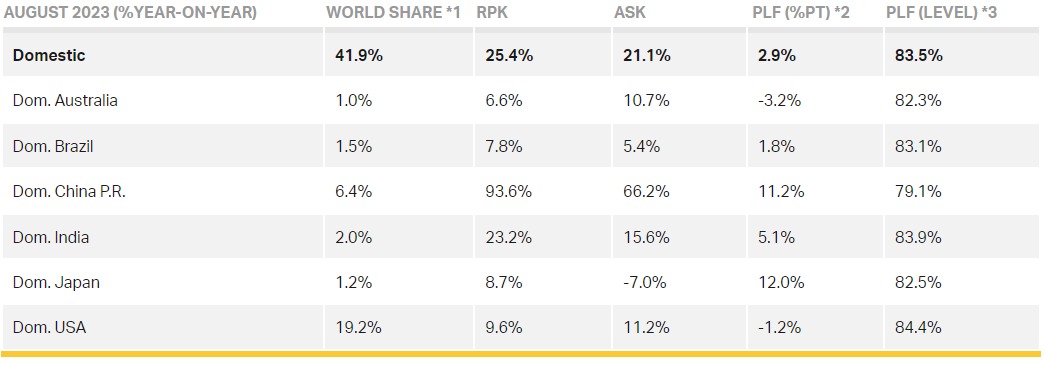
(*1) % of industry RPKs in 2022 – (*2) Change in load factor – (*3) Load factor level
Indian domestic RPKs rose 23.2% compared to a year ago and have now exceeded pre-pandemic levels for seven consecutive months.
Japan’s domestic market was impacted by Typhoon Khanun which caused major air traffic disruptions in southern Japan. Domestic RPKs grew 8.7% year over year, down on the 13.4% growth recorded in the previous month.
Air passenger market overview

1) % of industry RPKs in 2022 – 2) year-on-year change in load factor – 3) Load Factor Level
The bottom line
“Heading into the last quarter of the year, the airline industry is nearly fully recovered to 2019 levels of demand. The focus, however, has not been on getting back to a specific number of passengers or flights, but rather on meeting the demand by businesses and individuals for connectivity that was artificially suppressed for more than two years. Having seen the economic, social, and personal losses when airlines could not fly during the COVID-19 crisis, this industry is determined to secure a sustainable long-term future by achieving net zero carbon emissions by 2050. That was clearly evident at the first IATA World Sustainability Symposium (WSS) where discussions focused on how to decarbonize. We know that our customers want a world in which they can enjoy the freedom to travel sustainably. This inaugural WSS was a critical step in aligning policy makers, the aviation value chain and airlines with the concrete steps needed to deliver. And we will measure progress when we meet again in a year’s time,” said Walsh.
Tags: Willie Walsh, IATA
