
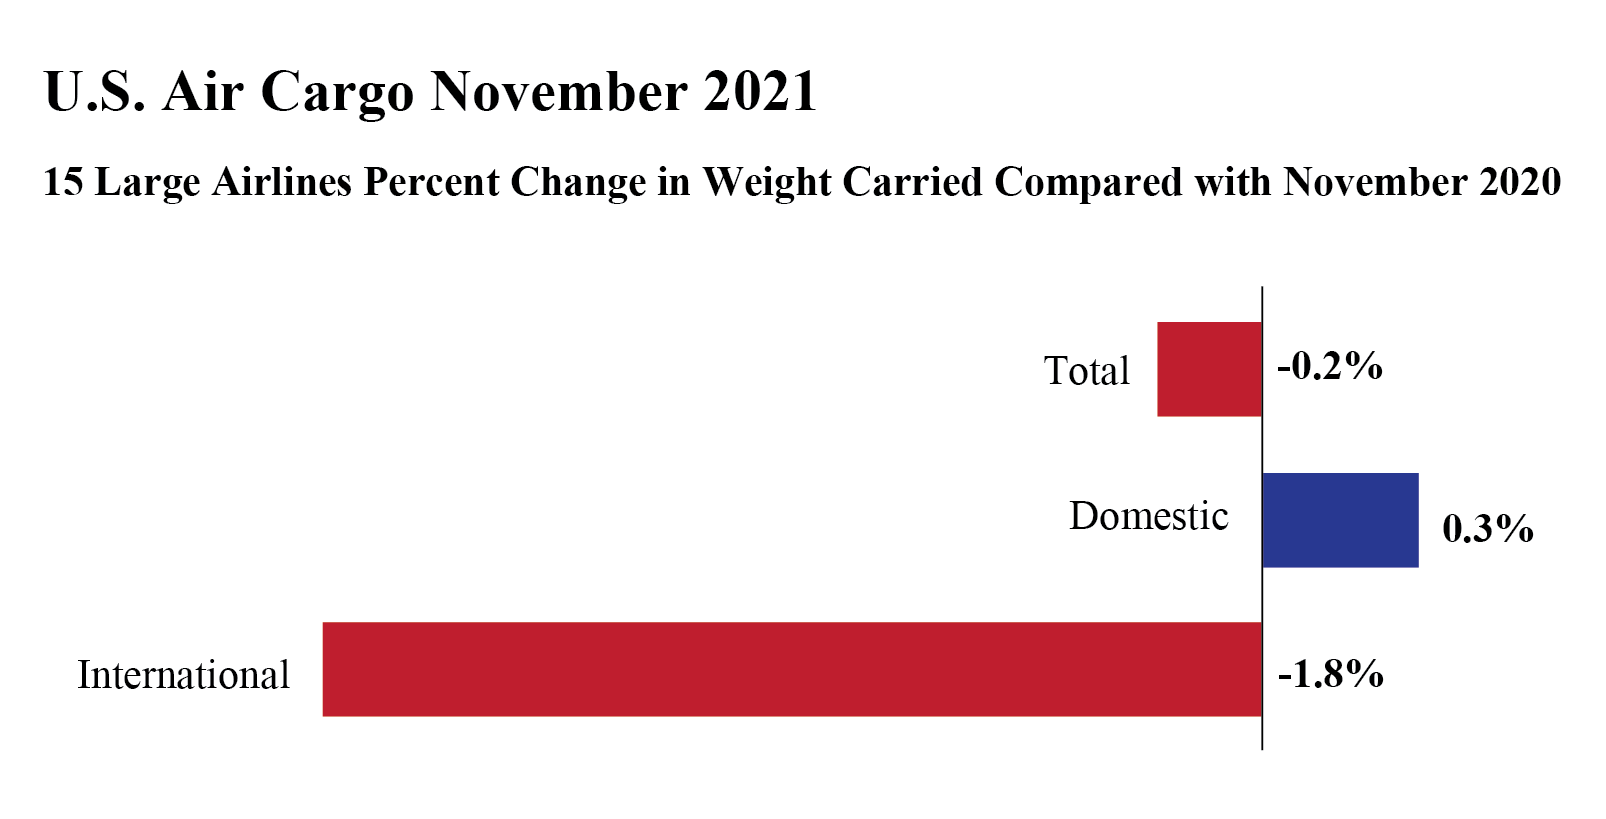
U.S. Airlines Carried 0.2% less cargo by weight in November 2021 (preliminary) than in November 2020. The decrease comprises a gain of 0.3% in domestic cargo and a loss of 1.8% in international cargo, according to data filed with the Bureau of Transportation Statistics (BTS) by 14 of the leading U.S. cargo airlines.
The 14 airlines carry 95% of total cargo by weight transported on U.S. airlines. Cargo data consists of freight and mail carried within the U.S. and between the U.S. and foreign points.
November 2021 (preliminary) air cargo numbers for 14 U.S. cargo carriers:
- Total: 1,650 thousand tons, down 0.2% from Nov. 2020, up 12.7% from Nov. 2019
- Domestic: 1,211 thousand tons, up 0.3% from Nov. 2020, up 14.0% from Nov. 2019
- International: 439 thousand tons, down 1.8% from Nov. 2020, up 9.4% from Nov. 2019
U.S. airline traffic reports are filed monthly with BTS. Final November data will be released on February 10, 2022. Complete international data by origin and destination, which is under a six-month confidentiality restriction, will be released on May 12, 2022.
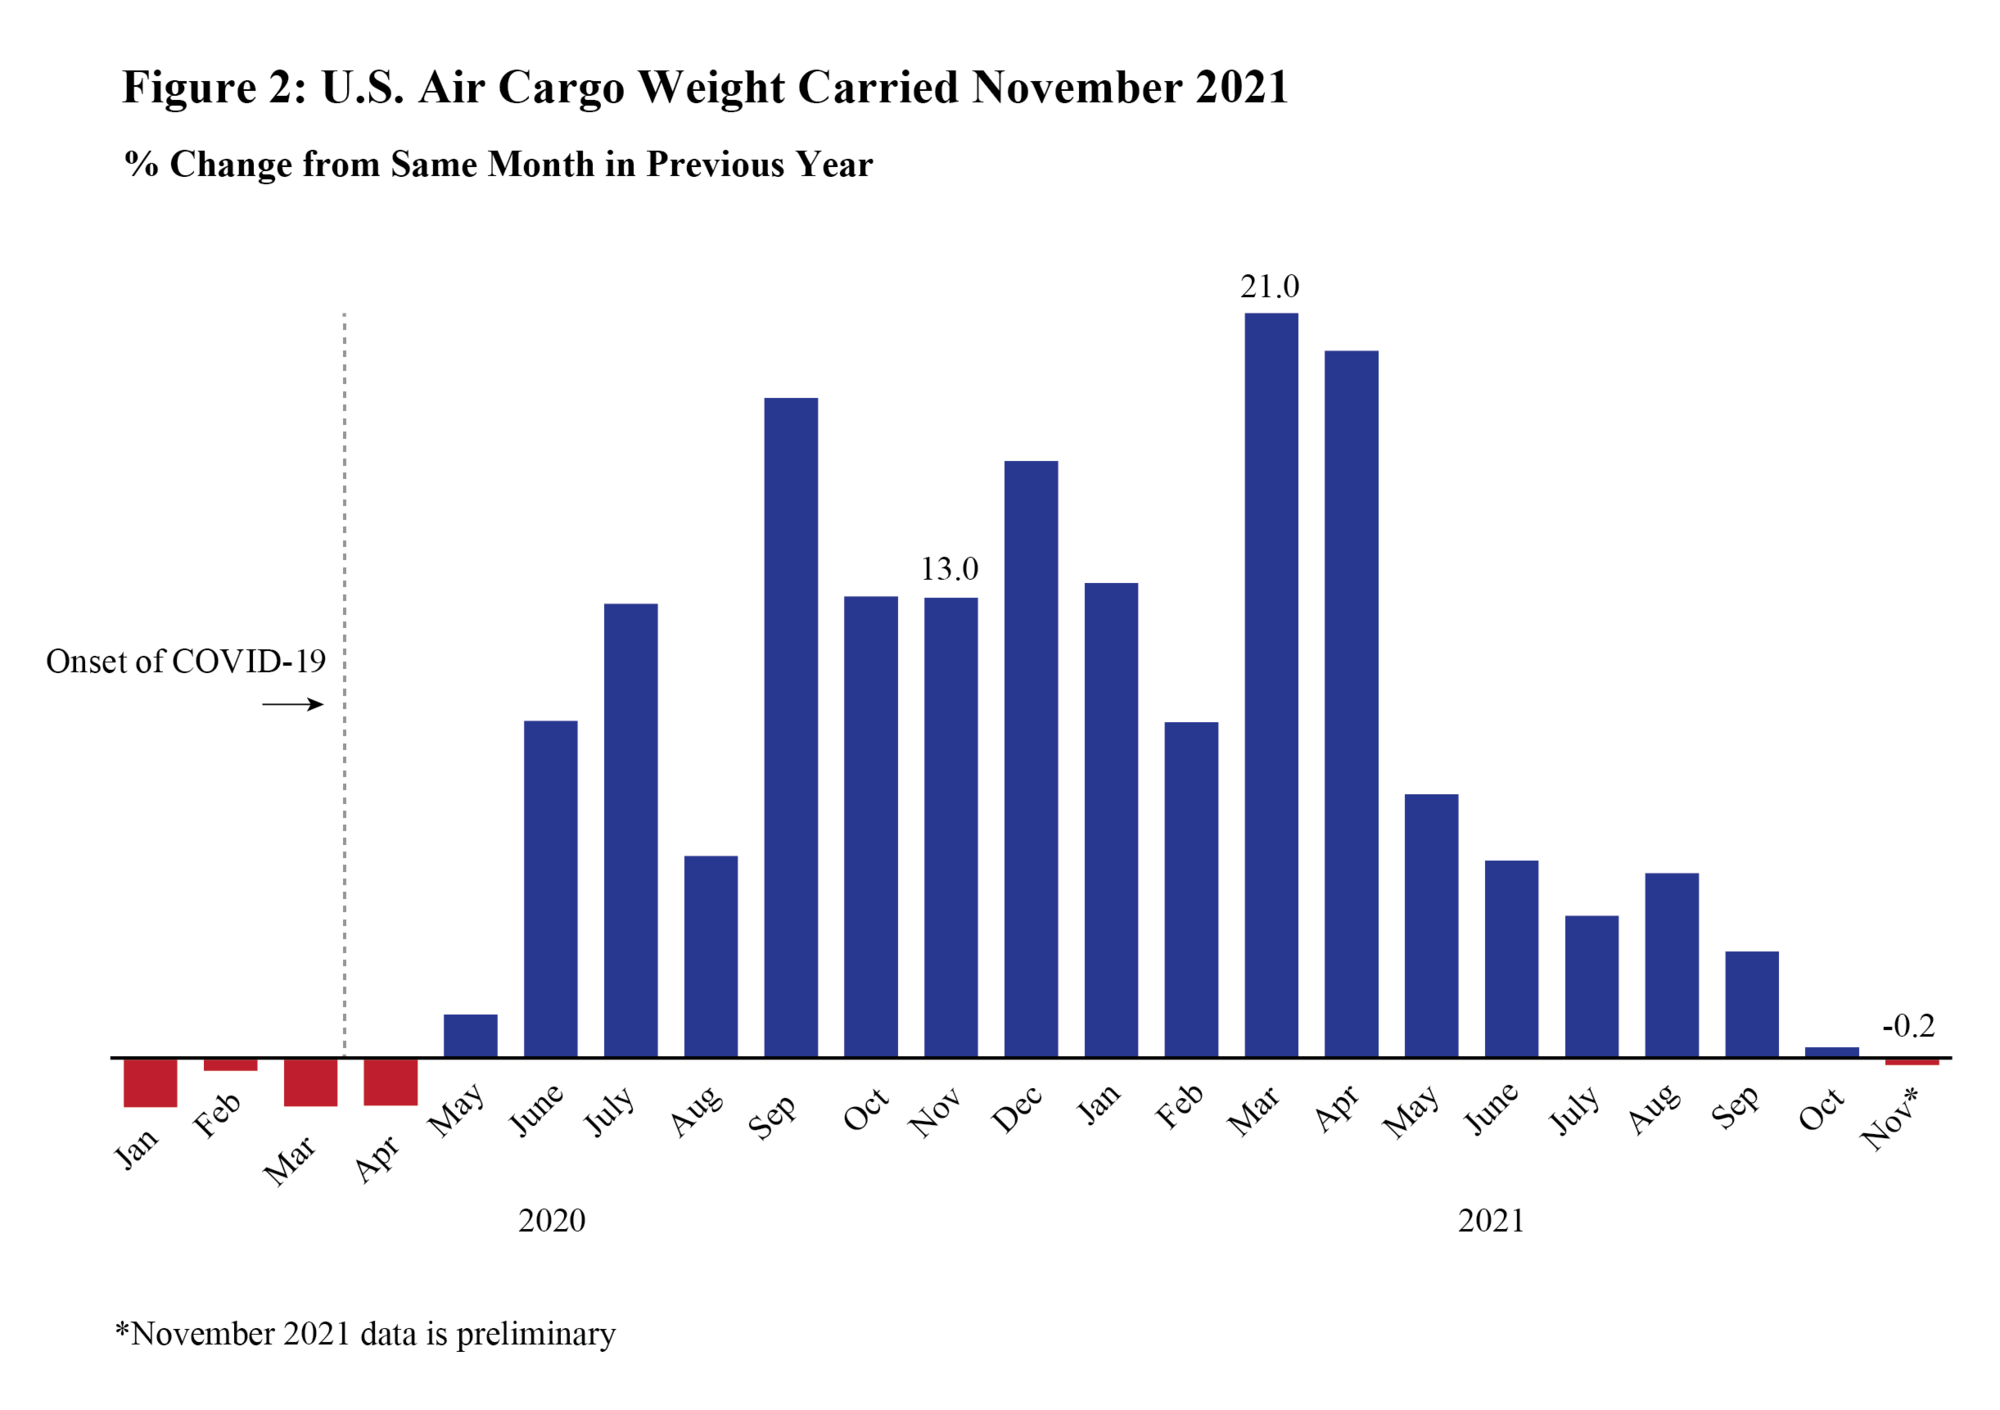
Systemwide Cargo (Domestic + International)
- November 2021 cargo: 1,649 thousand tons
- Change from October 2021: -4.8%
- Change from November 2020: -0.2%
- Change from November 2019: 12.7%
- Recent high: December 2020 (1,854 thousand tons)
- Recent low: February 2020 (1,255 thousand tons)
Year-to-Year Percent Change | ||||
| 2017 - 2018 | 2018 - 2019 | 2019 - 2020 | 2020 - 2021 |
January | 10.6 | 4.9 | -1.4 | 13.4 |
February | 9.3 | -0.4 | -0.4 | 9.5 |
March | 5.7 | -0.3 | -1.4 | 21.0 |
April | 5.7 | 4.5 | -1.3 | 20.0 |
May | 9.0 | 3.1 | 1.2 | 7.4 |
June | 5.6 | -1.2 | 9.5 | 5.6 |
July | 6.6 | 3.6 | 12.8 | 4.0 |
August | 4.8 | 0.2 | 5.7 | 5.2 |
September | 4.9 | -4.5 | 18.6 | 3.0 |
October | 5.7 | -1.2 | 13.0 | 0.3 |
November | -0.7 | -2.2 | 13.0 | -0.2 |
December | 0.2 | 0.7 | 16.9 | - |
YTD Jan - Jul | 6.7 | 0.8 | 5.7 | 8.5 |
Annual | 5.4 | 0.5 | 7.3 | - |
Domestic Cargo
- November 2021 cargo: 1,210 thousand tons
- Change from October 2021: -3.8%
- Change from November 2020: +0.3%
- Change from November 2019: 14.0%
- Recent high: December 2020 (1,420 thousand tons)
- Recent low: February 2020 (944 thousand tons)
- Domestic as percent of total cargo November 2021: 73.4%
- Domestic as percent of total cargo November 2020: 73.0%
- Domestic as percent of total cargo November 2019: 73.4%
Year-to-Year Percent Change | |||||
| 2017 - 2018 | 2018 - 2019 | 2019 - 2020 | 2020 - 2021 | |
January | 10.3 | 6.2 | 0.5 | 12.5 | |
February | 9.0 | 0.7 | 1.9 | 4.7 | |
March | 3.9 | -0.2 | 3.4 | 15.9 | |
April | 4.9 | 8.2 | 3.8 | 12.6 | |
May | 9.0 | 4.6 | 4.7 | 2.0 | |
June | 4.6 | 0.7 | 13.3 | 2.6 | |
July | 6.7 | 6.7 | 15.8 | 1.1 | |
August | 4.7 | 0.2 | 7.2 | 4.0 | |
September | 4.1 | -2.8 | 21.7 | 1.3 | |
October | 6.1 | 1.7 | 14.3 | -2.4 | |
November | -0.4 | -1.6 | 13.6 | 0.3 | |
December | 0.1 | 4.6 | 15.9 | - | |
YTD Jan - Nov | 6.2 | 2.5 | 8.7 | 5.1 | |
Annual | 5.0 | 2.4 | 9.8 | - | |
International Cargo
- November 2021 cargo: 439 thousand tons
- Change from October 2021: -7.4%
- Change from November 2020: -1.8%
- Change from November 2019: 9.4%
- Recent high: November 2020 (447 thousand tons)
- Recent low: February 2020 (311 thousand tons)
- Domestic as percent of total cargo November 2021: 26.6%
- Domestic as percent of total cargo November 2020: 27.0%
- Domestic as percent of total cargo November 2019: 26.6%
Year-to-Year Percent Change | |||||
| 2017 - 2018 | 2018 - 2019 | 2019 - 2020 | 2020 - 2021 | |
January | 11.3 | 1.5 | -6.7 | 16.0 | |
February | 10.2 | -3.4 | -6.7 | 24.0 | |
March | 10.6 | -0.5 | -13.6 | 36.9 | |
April | 7.7 | -4.5 | -15.4 | 44.6 | |
May | 8.9 | -1.0 | -8.4 | 24.6 | |
June | 8.4 | -5.7 | -0.7 | 14.5 | |
July | 6.5 | -4.1 | 4.5 | 12.9 | |
August | 5.2 | 0.1 | 1.6 | 8.9 | |
September | 6.8 | -8.8 | 10.5 | 8.2 | |
October | 4.6 | -8.7 | 9.5 | 8.1 | |
November | -1.5 | -3.7 | 11.4 | -1.8 | |
December | 0.4 | -10.7 | 20.1 | - | |
YTD Jan - Nov | 7.9 | -3.6 | -2.5 | 18.9 | |
Annual | 6.4 | -4.2 | 0.4 | - | |
* November data is preliminary