In the second quarter of 2021, the airlines reduced their first-quarter losses by 124%. The second-quarter after-tax net profit of $1.0 billion was a $5.2 billion net change from the first-quarter loss of $4.2 billion. The second-quarter pre-tax operating loss of $3.6 billion was a $9.1 billion reduction from the first-quarter loss of $12.7 billion.
U.S. airline financial reports are filed quarterly with the Bureau of Transportation Statistics (BTS). See the tables that accompany this release on the BTS website for additional second-quarter 2021 financial results (Tables 1-6).
Payroll protection payments received by airlines are included in net income calculations as part of non-operating income.
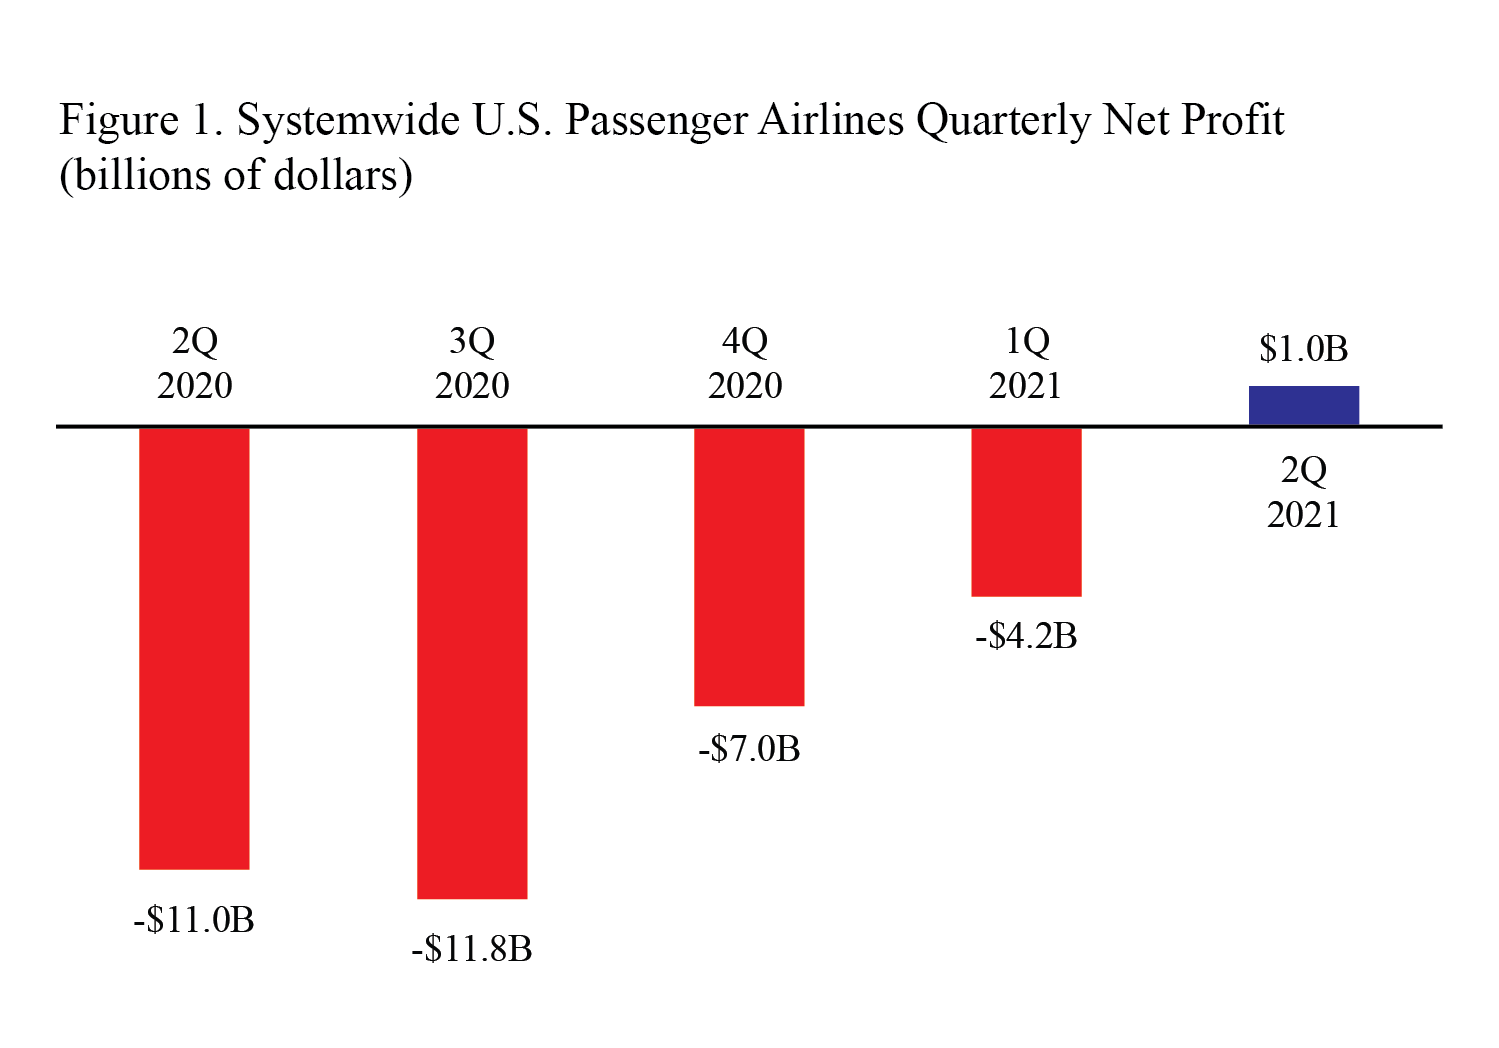
Systemwide operations, includes 24 U.S. airlines:
After-tax net profit/loss (net income)
- $1.0 billion profit in 2Q 2021
- Compared to $4.2 billion loss in 1Q 2021
- Compared to $11.0 billion loss in 2Q 2020
- Compared to $4.8 billion profit in pre-pandemic 2Q 2019
Pre-tax operating profit/loss
- $3.6 billion loss in 2Q 2021
- Compared to $12.7 loss in 1Q 2021
- Compared to $16.3 billion loss in 2Q 2020
- Compared to $6.9 billion profit in pre-pandemic 2Q 2019
Total 2Q 2021 operating revenue: $31.6 billion Share of total 2Q 2021 operating revenue:
- Fares: $20.7 billion, 65.5%, compared to $4.0 billion in 2Q 2020
- Baggage fees: $1.4 billion, 4.4%, compared to $221.2 million in 2Q 2020
- Reservation change fees: $137.2 million, 0.4%, compared to $80.8 million in 2Q 2020
Fees are included for calculations of net income, operating revenue and operating profit or loss.
- Fuel: $5.5 billion, 15.6%, compared to $1.2 billion in 2Q 2020
- Labor: $12.5 billion, 35.7%, compared to $11.3 billion in 2Q 2020
Domestic operations, includes 24 U.S. airlines:
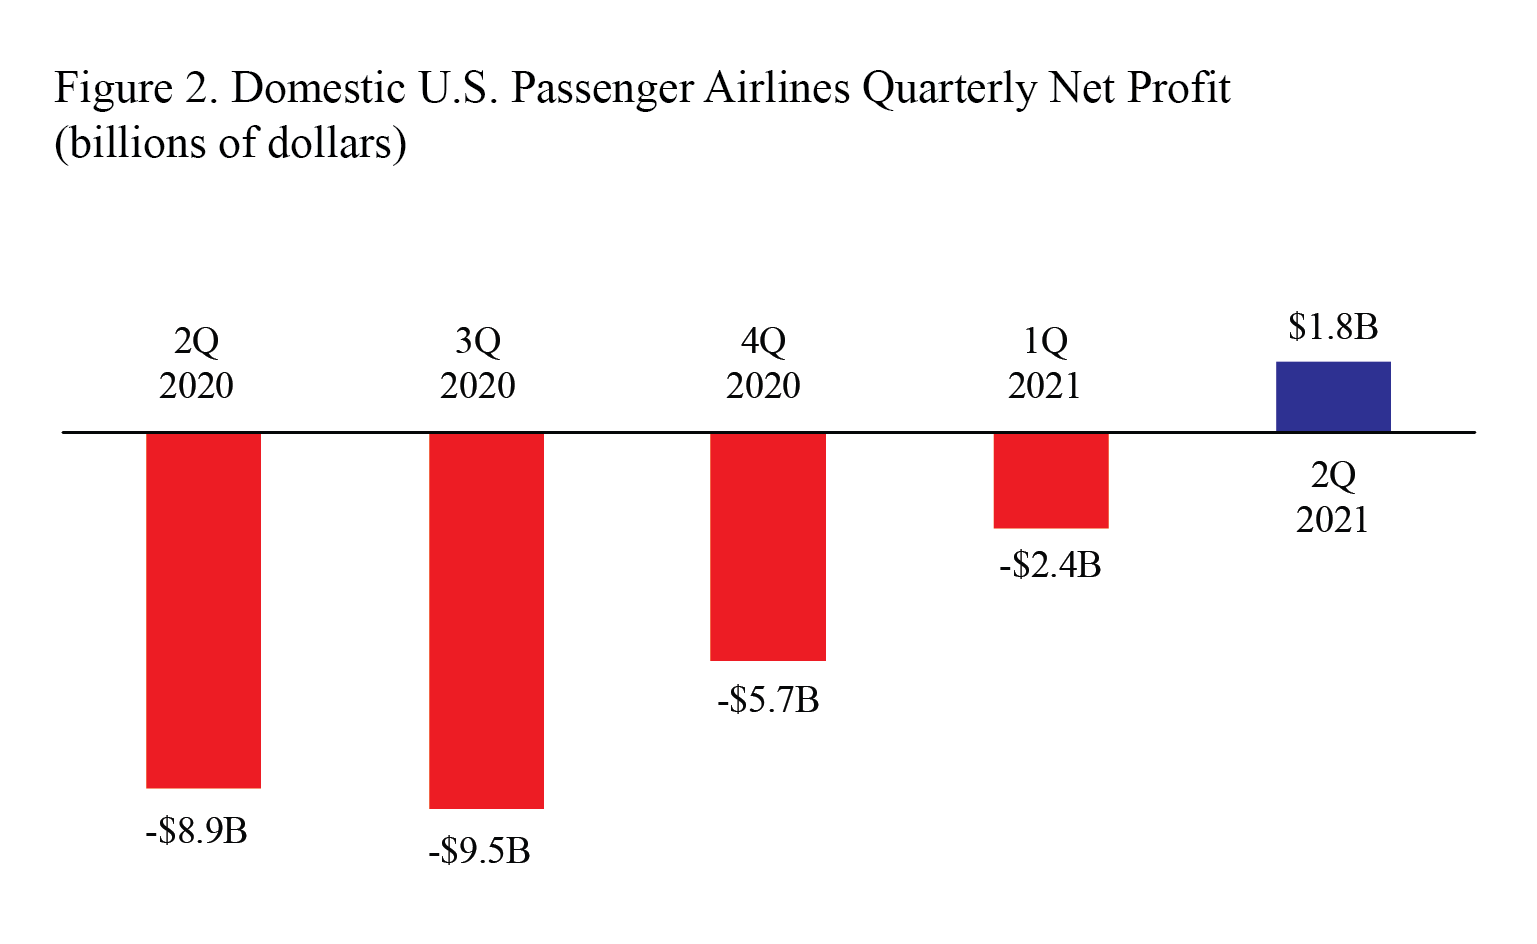
After-tax domestic net profit/loss (net income)
- $1.8 billion profit in 2Q 2021
- Compared to $2.4 billion loss in 1Q 2021
- Compared to $9.0 billion loss in 2Q 2020
- Compared to $3.6 billion profit in pre-pandemic 2Q 2019
Pre-tax domestic operating profit/loss
- $2.1 billion loss in 2Q 2021
- Compared to $9.6 billion loss in 1Q 2021
- Compared to $14.1 billion loss in 2Q 2020
- Compared to $5.2 billion profit in pre-pandemic 2Q 2019
- Fares: $17.3 billion, 65.7%, compared to $3.7 billion in 2Q 2020
- Baggage fees: $1.1 billion, 4.3%, compared to $201.7 million in 2Q 2020
- Reservation change fees: $121.0 million, 0.5%, compared to $62.8 million in 2Q 2020
Fees are included for calculations of net income, operating revenue and operating profit or loss.
2Q 2021 domestic operating expenses: $28.5 billion Share of total 2Q 2021 domestic operating expenses:
- Fuel: $4.2 billion, 14.6%, compared to $898.3 million in 2Q 2020
- Labor: $9.9 billion, 34.9%, compared to $9.5 billion in 2Q 2020
International operations, includes 19 U.S. airlines:
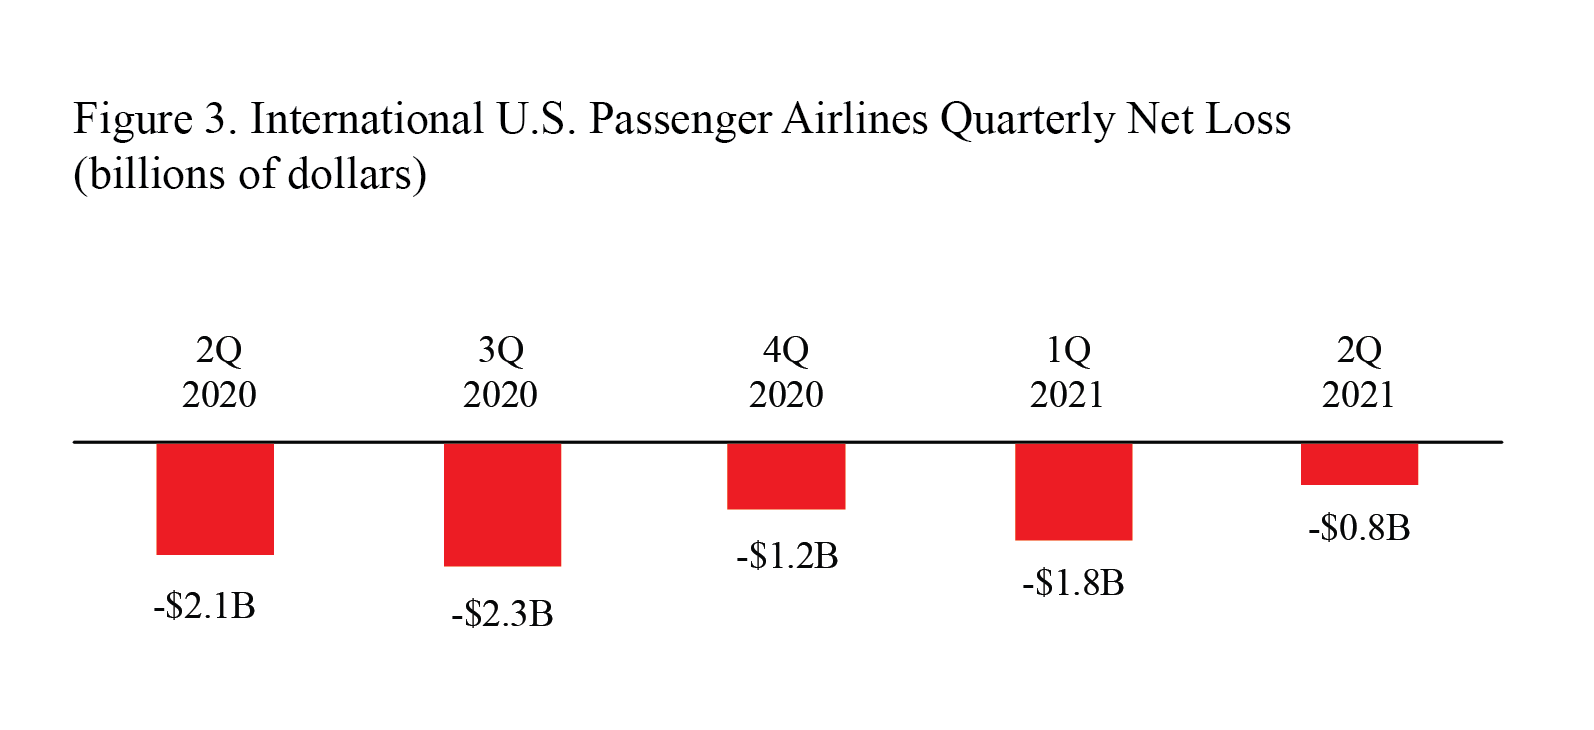
After-tax international net profit/loss (net income)
- $773.8 million loss in 2Q 2021
- Compared to $1.8 billion loss in 1Q 2021
- Compared to $2.1 billion loss in 2Q 2020
- Compared to $1.2 billion profit in pre-pandemic 2Q 2019
Pre-tax international operating profit/loss
- $1.5 billion loss in 2Q 2021
- Compared to $3.0 billion loss in 1Q 2021
- Compared to $2.1 billion loss in 2Q 2020
- Compared to $1.6 billion profit in pre-pandemic 2Q 2019
- Fares: $3.3 billion, 64.7%, compared to $340.0 million in 2Q 2020
- Baggage fees: $250.0 million, 4.9%, compared to $19.5 million in 2Q 2020
- Reservation change fees: $16.3 million, 0.3%, compared to $18.0 million in 2Q 2020
Fees are included for calculations of net income, operating revenue and operating profit or loss.
2Q 2021 international operating expenses: $6.6 billion
Share of total 2Q 2021 international operating expenses:
- Fuel: $1.3 billion, 20.0%, compared to $253.8 million in 2Q 2020
- Labor: $2.6 billion, 39.3%, compared to $1.8 billion in 2Q 2020
2nd Quarter Margins
Net margin is the net income or loss as a percentage of operating revenue. Operating margin is the operating profit or loss as a percentage of operating revenue.
Systemwide: Net margin:
- 2% in 2Q2021
- Compared to -140.6% in 2Q 2020
Operating margin:
- -11.3% in 2Q2021
- Compared to -207.0% in 2Q 2020
Domestic Net margin:
- 7% in 2Q2021
- Compared to -132.2% in 2Q 2020
Operating margin:
- -7.9% in 2Q2021
- Compared to -208.7% in 2Q 2020
International Net margin:
- -15.1% in 2Q2021
- Compared to -193.0% in 2Q 2020
Operating margin:
- -28.8% in 2Q2021
- Compared to -196.0% in 2Q 2020