
BTS reported 59.1 million domestic passengers and 10.4 million international passengers on U.S. airlines flights in January, not adjusting for seasonality.
U.S. airline traffic reports are filed monthly with BTS. See the tables that accompany this release on the BTS website for summary data since 2016 (Tables 1-24) and complete data since 2000.
Trends (not seasonally adjusted) in U.S. airlines passenger enplanements
January unadjusted
- Systemwide enplanements (69.5M) were down 1.8% from the all-time January high (70.8) reached in 2020.
- Domestic enplanements (59.1M) were down 4.1% from the all-time January high (61.6) reached in 2020.
- International enplanements (10.38M) reached a new all-time high for the month of January.
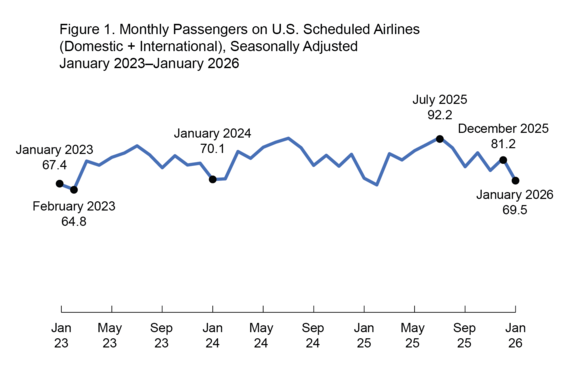
Table A. Unadjusted Passenger Enplanements Compared to Previous Time Periods
Unadjusted | Passengers | Percent Change Compared to | ||
|---|---|---|---|---|
|
| Previous | Two Years Previous | Three Years Previous |
January | 69.5 | -1.8% | -0.8% | 3.2% |
Seasonally adjusted trends in U.S. airlines passenger enplanements
January seasonally adjusted
- Systemwide enplanements (80.2M) were down 3.7% from the all-time high of 83.3 million reached in June 2024.
- Domestic enplanements (69.3M) were down 4.3% from the all-time high of 72.4 million reached in June 2024.
- International enplanements (10.98M) were down 1.1% from the all-time high of 11.1 million reached in December 2024.
Table B. Seasonally Adjusted Passenger Enplanements Compared to Previous Time Periods
Seasonally | Passengers | Percent Change Compared to | ||
|---|---|---|---|---|
|
| Previous | Previous | Three Years |
January | 80.2 | -1.1% | -1.0% | 3.2% |
For data filed through January, see accompanying tables. For the complete database of reported data, see Traffic. For an explanation of BTS’ seasonal adjustment methodology, see Seasonal Adjustment.
Tags: US DOT