U.S. airline financial reports are filed quarterly with the Bureau of Transportation Statistics (BTS). See the tables that accompany this release on the BTS website for additional first-quarter (Tables 1-6) financial results.
1Q 2023 Results for All 26 Scheduled U.S. Passenger Airlines
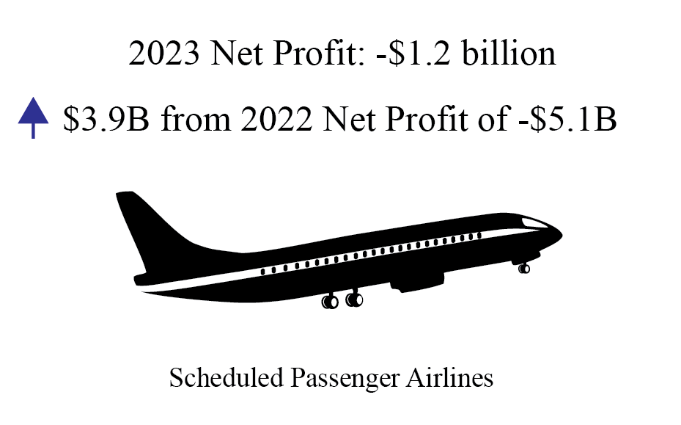
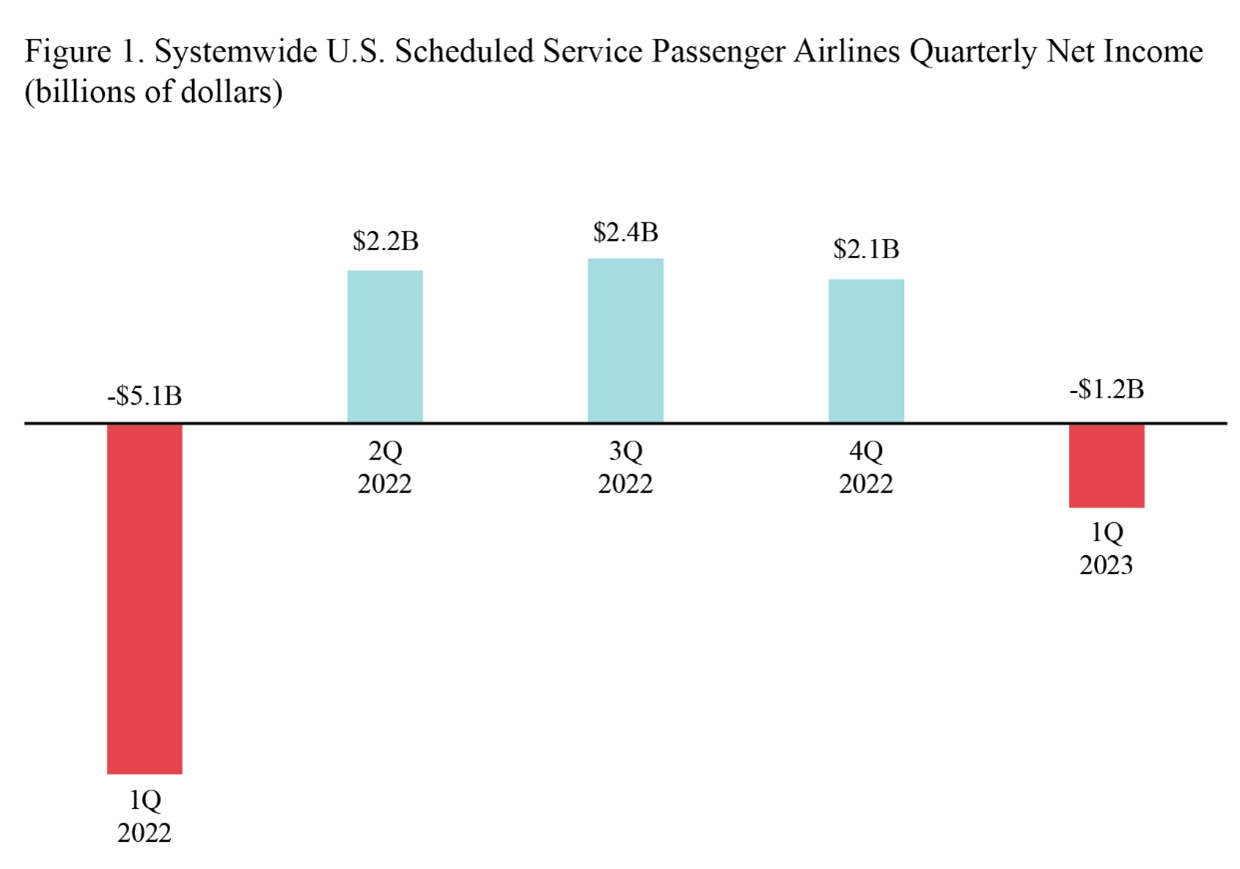
U.S. scheduled passenger airlines reported a first-quarter 2023 after-tax net loss of $1.2 billion and a pre-tax operating gain of $32 million.
One year earlier, in the first quarter of 2022, the airlines reported an after-tax net loss of $5.1 billion and a pre-tax operating loss of $5.2 billion.
After-tax net income
- $1.2 billion loss in 1Q 2023
- Compared to $2.1 billion gain in 4Q 2022
- Compared to $5.1 billion loss in 1Q 2022
Pre-tax operating profit
- $32 million gain in 1Q 2023
- Compared to $3.7 billion gain in 4Q 2022
- Compared to $5.2 billion loss in 1Q 2022
- Total 1Q 2023 operating revenue: $52.9 billion
Share of total 1Q 2023 operating revenue:
- Fares: $39.5 billion, 74.6%, compared to 68.9% in 1Q 2022
- Baggage fees: $1.7 billion, 3.3%, compared to 3.7% in 1Q 2022
- Reservation change fees: $256 million, 0.5%, compared to 0.6% in 1Q 2022
Fees are included for calculations of net income, operating revenue and operating profit or loss.
- Total 1Q 2023 operating expenses: $52.9 billion:
Share of total 1Q 2023 operating expenses:
- Fuel: $12.0 billion, 22.6%, compared to 19.5% in 1Q 2022
- Labor: $17.7 billion, 33.4%, compared to 34.2% in 1Q 2022
Domestic operations, includes 26 U.S. airlines:
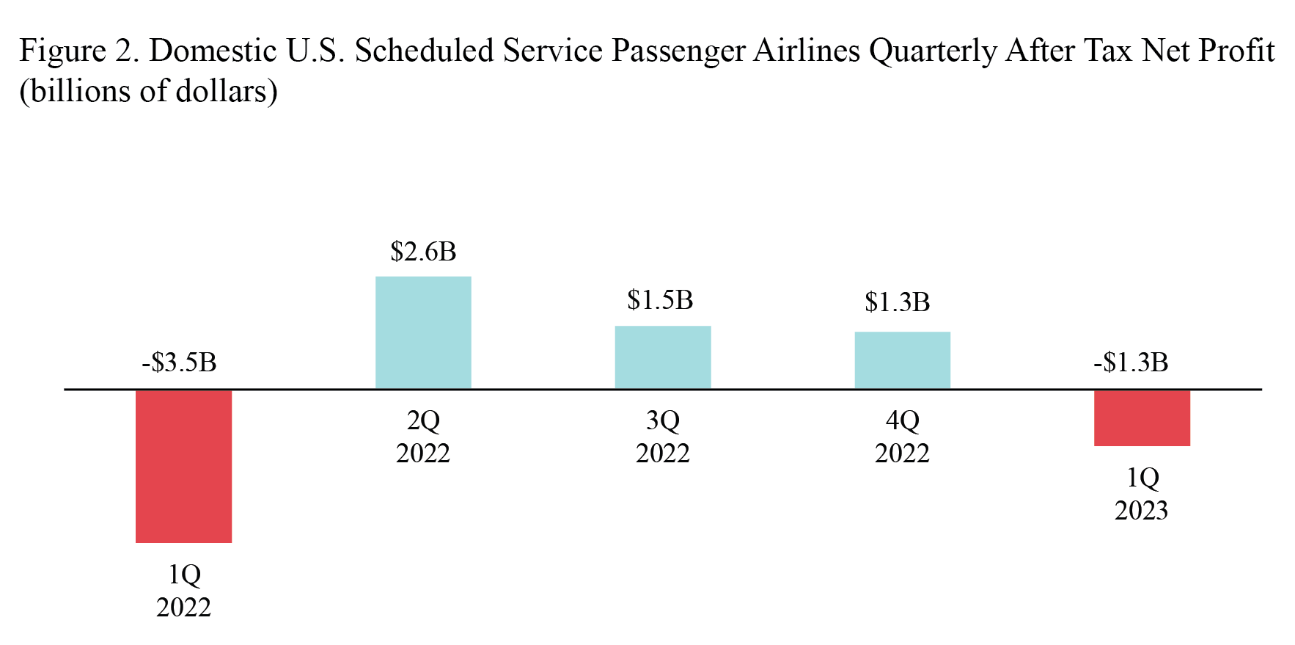
After-tax domestic net profit (net income)
- $1.3 billion loss in 1Q 2023
- Compared to $1.3 billion gain in 4Q 2022
- Compared to $3.5 billion loss in 1Q 2022
Pre-tax domestic operating profit
- $403 million loss in 1Q 2023
- Compared to $2.7 billion gain in 4Q 2022
- Compared to $3.6 billion loss in 1Q 2022
- 1Q 2023 domestic operating revenue: $40.4 billion
Share of total 1Q 2023 domestic operating revenue:
- Fares: $29.2 billion, 72.4%, compared to 68.3% in 1Q 2022
- Baggage fees: $1.4 billion, 3.5%, compared to 3.7% in 1Q 2022
- Reservation change fees: $219 million, 0.5%, compared to 0.6% in 1Q 2022
Fees are included for calculations of net income, operating revenue and operating profit or loss.
- 1Q 2023 domestic operating expenses: $40.8 billion, of which:
Share of total 1Q 2023 domestic operating expenses:
- Fuel: $8.6 billion, 21.0%, compared to 18.0% in 1Q 2022
- Labor: $13.6 billion, 33.4%, compared to 33.9% in 1Q 2022
International operations, includes 20 U.S. airlines:
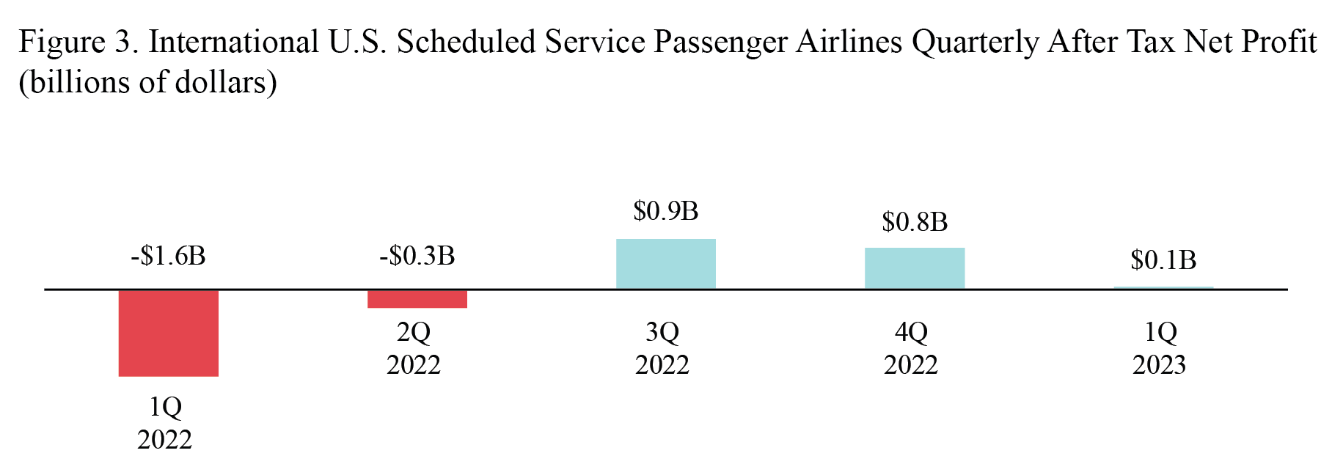
After-tax international net profit (net income)
- $53 million gain in 1Q 2023
- Compared to $782 million gain in 4Q 2022
- Compared to $1.6 billion loss in 1Q 2022
Pre-tax international operating profit
- $436 million gain in 1Q 2023
- Compared to $982 million gain in 4Q 2022
- Compared to $1.6 billion loss in 1Q 2022
- 1Q 2023 international operating revenue: $12.5 billion, of which:
Share of 1Q 2023 international operating revenue:
- Fares: $10.2 billion, 81.8%, compared to 71.3% in 1Q 2022
- Baggage fees: $323 million, 2.6%, compared to 3.8% in 1Q 2022
- Reservation change fees: $37 million, 0.3%, compared to 0.4% in 1Q 2022
Fees are included for calculations of net income, operating revenue and operating profit or loss.
- 1Q 2023 international operating expenses: $12.1 billion, of which:
Share of 1Q 2023 international operating expenses:
- Fuel: $3.4 billion, 28.2%, compared to 25.4% in 1Q 2022
- Labor: $4.0 billion, 33.5%, compared to 35.6% in 1Q 2022
1st Quarter Margins
Net margin is the net income or loss as a percentage of operating revenue. Operating margin is the operating profit or loss as a percentage of operating revenue.
Systemwide:
Net income margin:
- -2.3% in 1Q2023
- Compared to -13.1% in 1Q2022
Operating margin:
- 1% in 1Q2023
- Compared to -13.3% in 1Q2022
Domestic
Net income margin:
- -3.2% in 1Q2023
- Compared to -11.1% in 1Q2022
Operating margin:
- -1.0% in 1Q2023
- Compared to -11.4% in 1Q2022
International
Net income margin:
- 4% in 1Q2023
- Compared to -21.7% in 1Q2022
Operating margin:
- 5% in 1Q2023
- Compared to -21.0% in 1Q2022
More news on this category
Tags: US Airlines, US DOT