
1Q 2022 Results for All 25 Scheduled U.S. Passenger Airlines
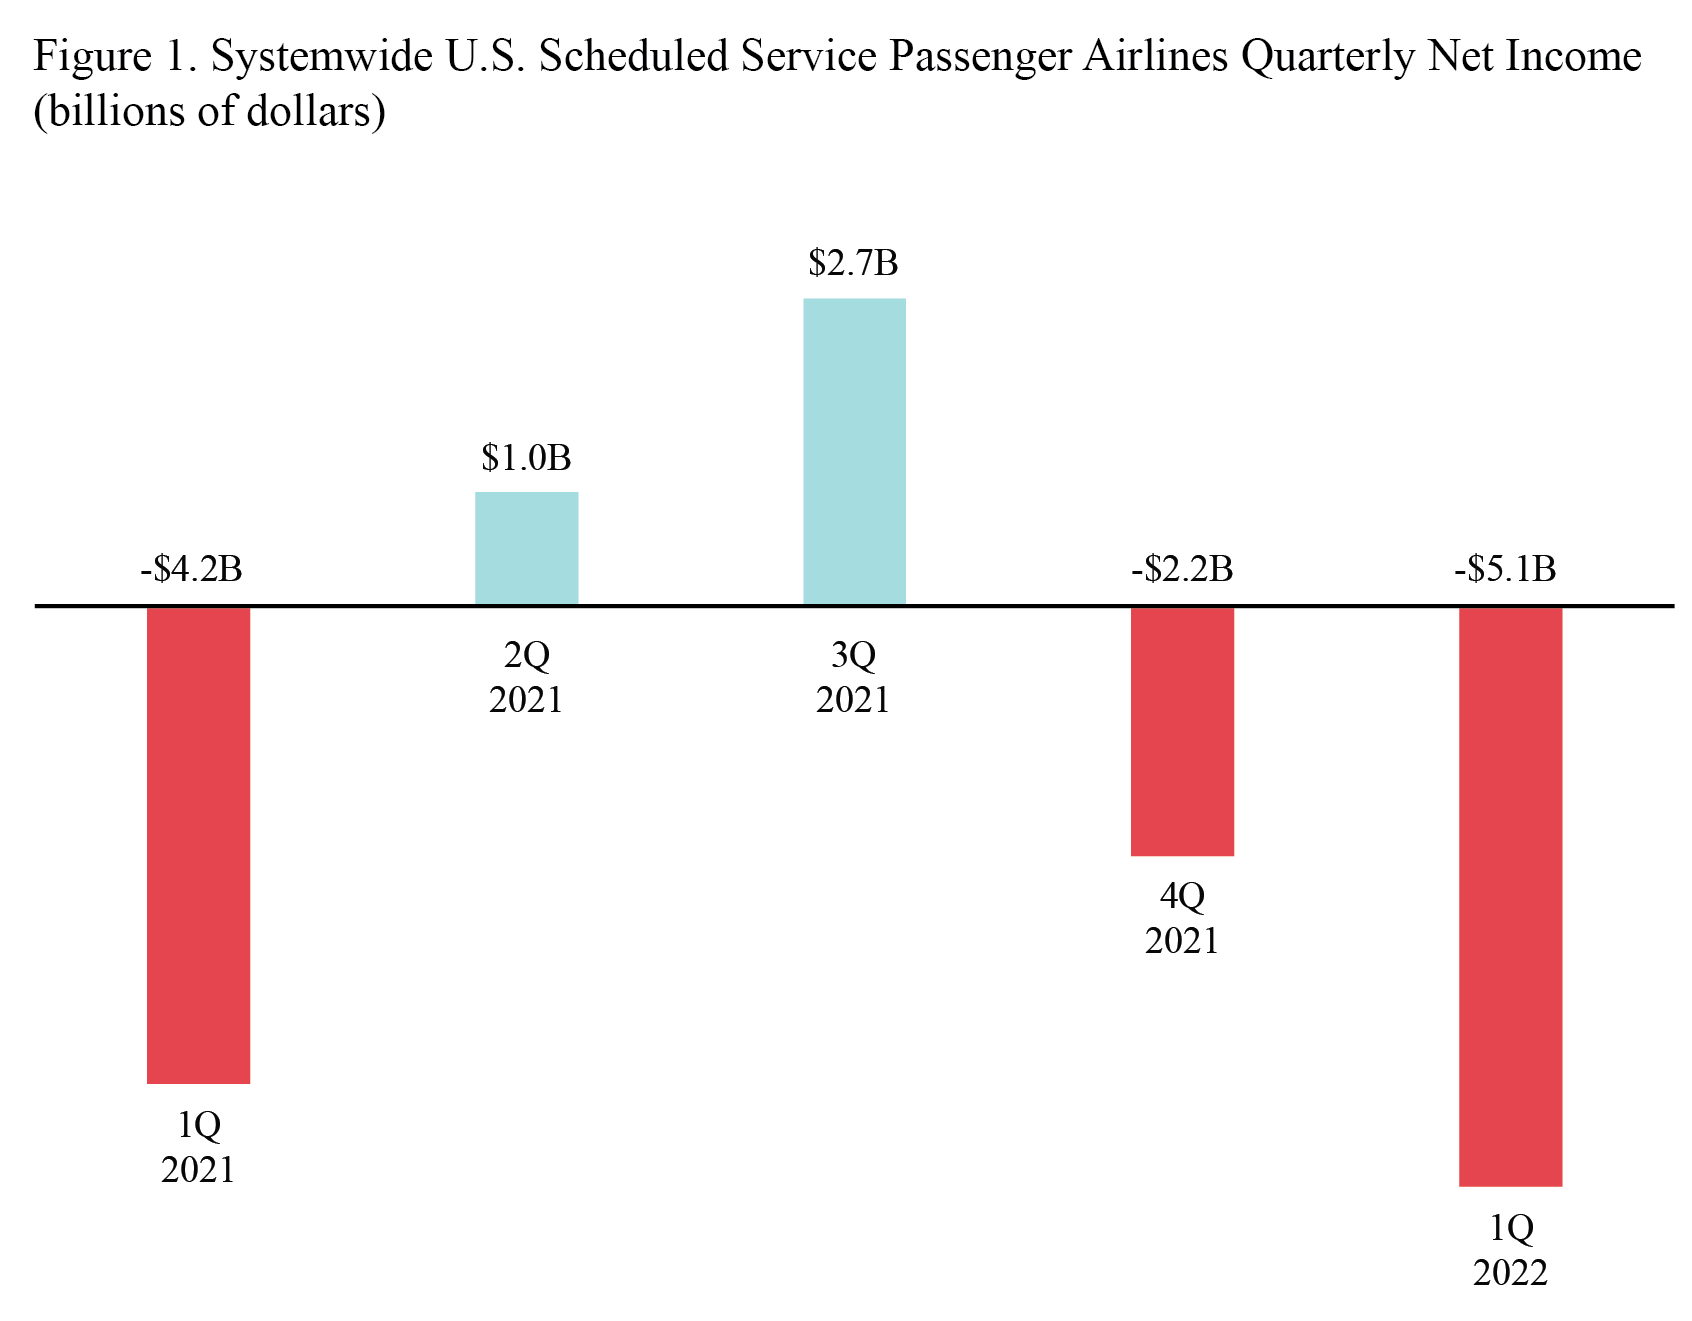
U.S. scheduled passenger airlines reported a first-quarter 2022 after-tax net loss of $5.1 billion and a pre-tax operating loss of $5.2 billion.
One year earlier, in the first quarter of 2021, the airlines reported an after-tax net loss of $4.2 billion and a pre-tax operating loss of $12.7 billion.
After-tax net income
- $5.1 billion loss in 1Q 2022
- Compared to $2.2 billion loss in 4Q 2021
- Compared to $4.2 billion loss in 1Q 2021
Pre-tax operating profit
- $5.2 billion loss in 1Q 2022
- Compared to $894 million loss in 4Q 2021
- Compared to $12.7 billion loss in 1Q 2021
- Total 1Q 2022 operating revenue: $39.1 billion
- Share of total 1Q 2022 operating revenue:
- Fares: $27.0 billion, 69.0%, compared to 59.2% in 1Q 2021
- Baggage fees: $1.4 billion, 3.7%, compared to 4.7% in 1Q 2021
- Reservation change fees: $216 million, 0.6%, compared to 0.6% in 1Q 2021
- Share of total 1Q 2022 operating revenue:
Fees are included for calculations of net income, operating revenue and operating profit or loss.
- Total 1Q 2022 operating expenses: $44.3 billion:
- Share of total 1Q 2022 operating expenses:
- Fuel: $8.6 billion, 19.5%, compared to 11.6% in 1Q 2021
- Labor: $15.1 billion, 34.1%, compared to 37.5% in 1Q 2021
- Share of total 1Q 2022 operating expenses:
Domestic operations, includes 25 U.S. airlines:
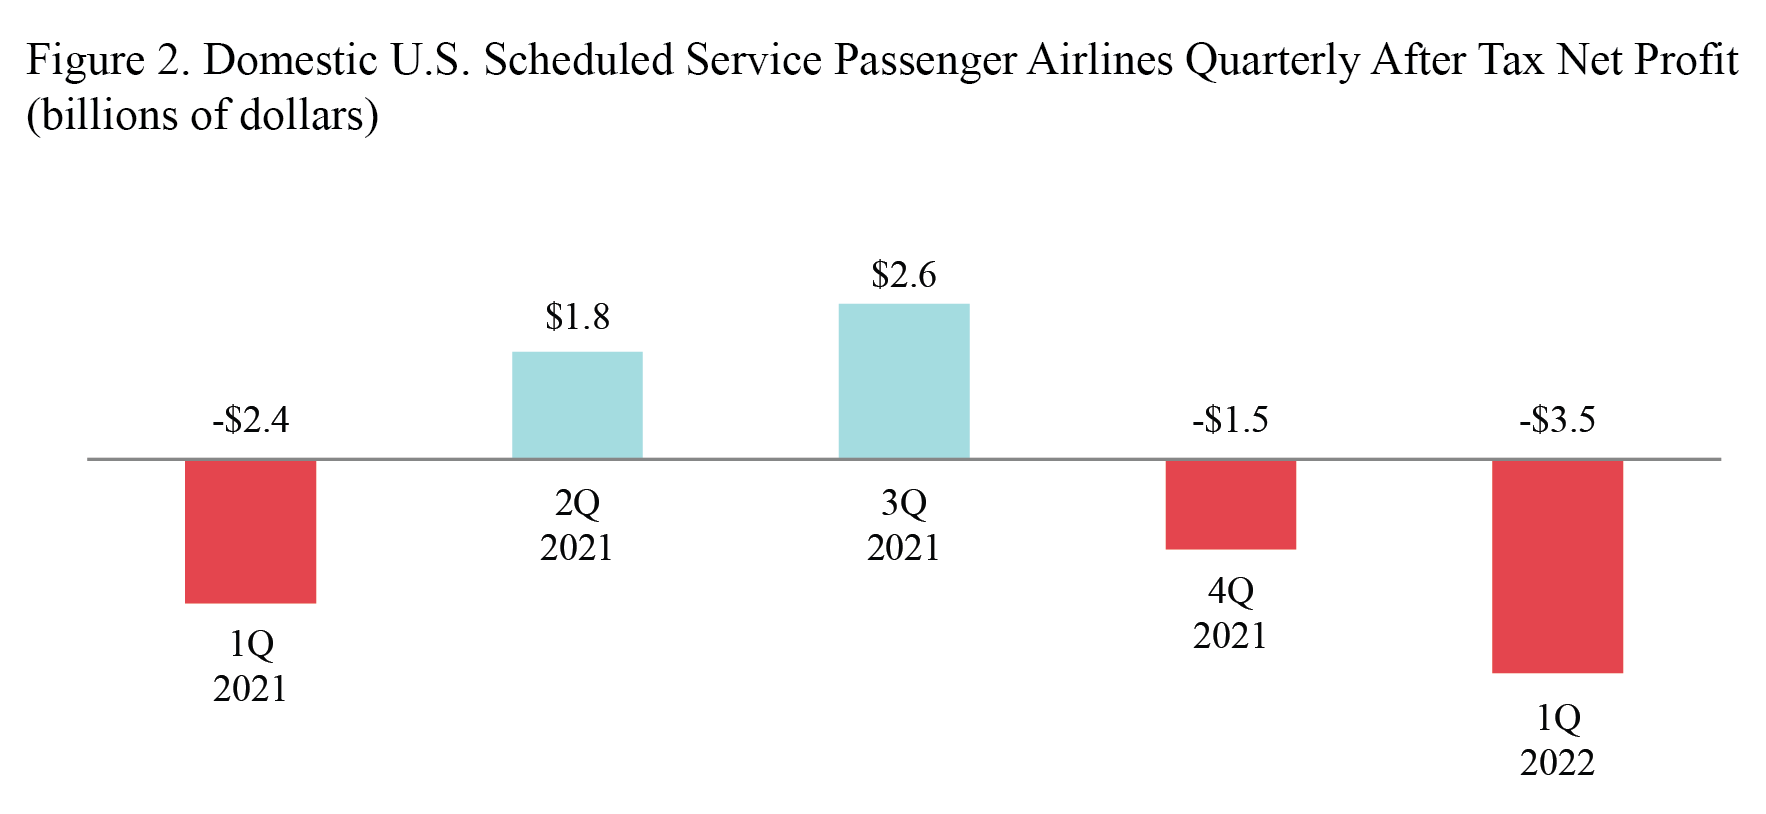
After-tax domestic net profit (net income)
- $3.5 billion loss in 1Q 2022
- Compared to $1.5 billion loss in 4Q 2021
- Compared to $2.4 billion loss in 1Q 2021
Pre-tax domestic operating profit
- $3.6 billion loss in 1Q 2022
- Compared to $484 million loss in 4Q 2021
- Compared to $9.6 billion loss in 1Q 2021
- 1Q 2022 domestic operating revenue: $31.6 billion
- Share of total 1Q 2022 domestic operating revenue:
- Fares: $21.6 billion, 68.4%, compared to 60.3% in 1Q 2021
- Baggage fees: $1.2 billion, 3.7%, compared to 4.6% in 1Q 2021
- Reservation change fees: $188 million, 0.6%, compared to 0.6% in 1Q 2021
- Share of total 1Q 2022 domestic operating revenue:
Fees are included for calculations of net income, operating revenue and operating profit or loss.
- 1Q 2022 domestic operating expenses: $35.2 billion, of which:
- Share of total 1Q 2022 domestic operating expenses:
- Fuel: $6.3 billion, 17.9%, compared to 10.5% in 1Q 2021
- Labor: $11.9 billion, 33.7%, compared to 36.4% in 1Q 2021
- Share of total 1Q 2022 domestic operating expenses:
International operations, includes 20 U.S. airlines:
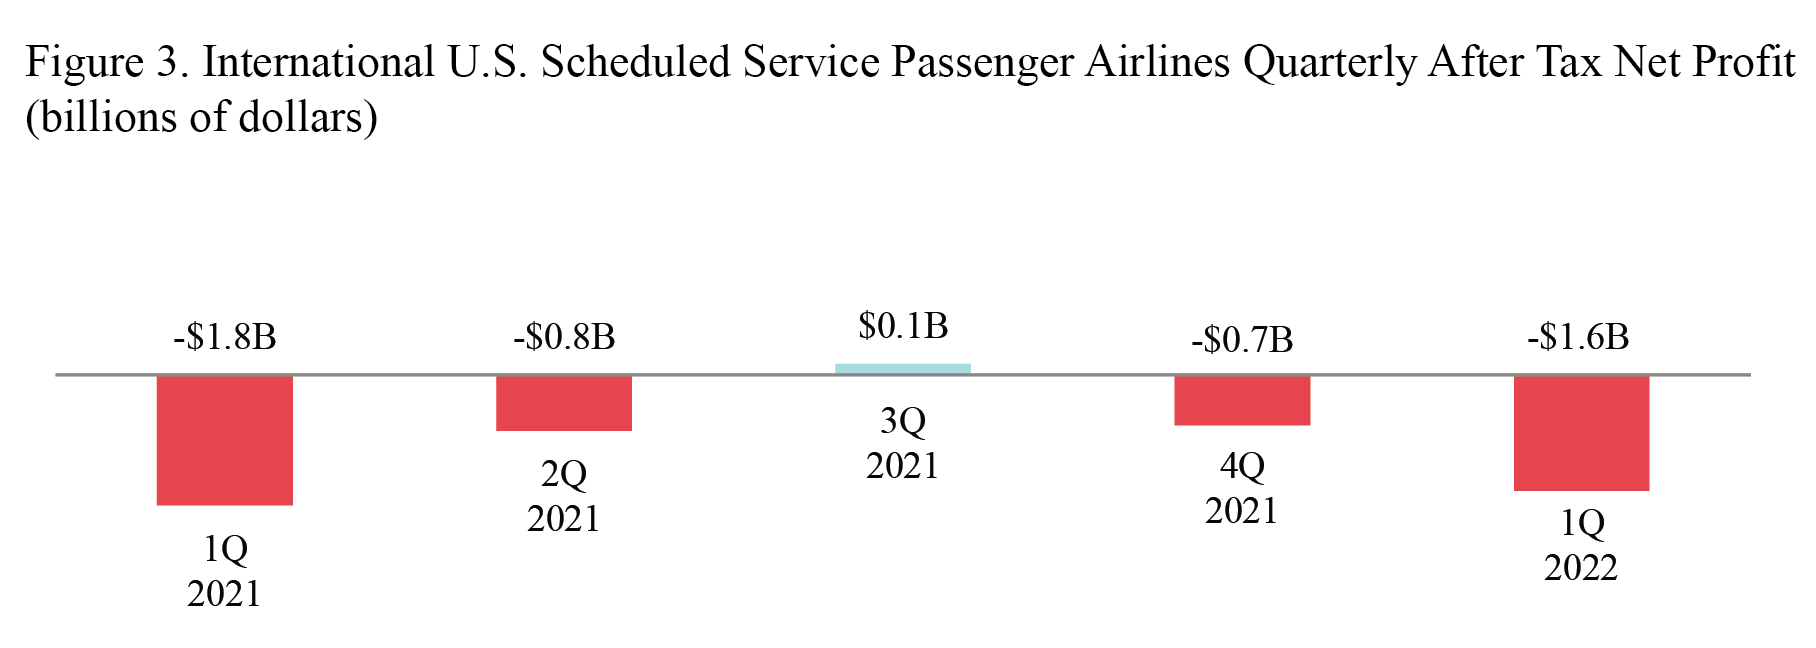
After-tax international net profit (net income)
- $1.6 billion loss in 1Q 2022
- Compared to $697 million loss in 4Q 2021
- Compared to $1.8 billion loss in 1Q 2021
Pre-tax international operating profit
- $1.6 billion loss in 1Q 2022
- Compared to $409 million loss in 4Q 2021
- Compared to $3.0 billion loss in 1Q 2021
- 1Q 2022 international operating revenue: $7.5 billion, of which:
- Share of 1Q 2022 international operating revenue:
- Fares: $5.4 billion, 71.3%, compared to 54.5% in 1Q 2021
- Baggage fees: $286 million, 3.8%, compared to 5.0% in 1Q 2021
- Reservation change fees: $29 million, 0.4%, compared to 0.5% in 1Q 2021
- Share of 1Q 2022 international operating revenue:
Fees are included for calculations of net income, operating revenue and operating profit or loss.
- 1Q 2022 international operating expenses: $9.1 billion, of which:
- Share of 1Q 2022 international operating expenses:
- Fuel: $2.3 billion, 25.4%, compared to 15.7% in 1Q 2021
- Labor: $3.2 billion, 35.6%, compared to 41.5% in 1Q 2021
- Share of 1Q 2022 international operating expenses:
1st Quarter Margins
Net margin is the net income or loss as a percentage of operating revenue. Operating margin is the operating profit or loss as a percentage of operating revenue.
Systemwide:
Net income margin:
- -13.1% in 1Q2022
- Compared to -23.8% in 1Q2021
Operating margin:
- -13.2% in 1Q2022
- Compared to -70.9% in 1Q2021
Domestic
Net income margin:
- -11.0% in 1Q2022
- Compared to -16.4% in 1Q2021
Operating margin:
- -11.4% in 1Q2022
- Compared to -65.7% in 1Q2021
International
Net income margin:
- -21.7% in 1Q2022
- Compared to -57.7% in 1Q2021
Operating margin:
- -21.0% in 1Q2022
- Compared to -95.0% in 1Q2021
Reporting notes
Additional data: BTS website, see tables for operating profit/loss, operating revenue and fuel cost and consumption. See the BTS financial databases for more detailed data including numbers for individual airlines.
Filing requirement: By regulation, for the quarter ending Mar. 31, airlines that operate at least one aircraft that is designed/certified for more than 60 seats or the capacity to carry a payload of passengers and cargo weighing more than 18,000 pounds must report financial data to BTS by March 31. The airline filings are subject to a process of quality assurance and data validations before release to the public.
Data updates: Revised carrier data and late data filings will be made available monthly on TranStats on the Monday following the second Tuesday of the month. All data are subject to revision. BTS will release second-quarter 2022 data on September 12.
Tags: US DOT