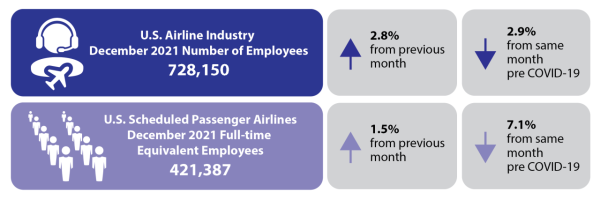
U.S. scheduled service passenger airlines employed 445,092 workers in December 2021 or 61% of the industry-wide total. Passenger airlines added 8,926 employees (6,312 full-time equivalent employees or FTEs) in December for an eighth consecutive month of job growth dating back to May 2021. United Airlines led scheduled passenger carriers, adding 6,491 employees. U.S. cargo airlines employed 283,051 workers in December, 39% of the industry total. Cargo carriers added 11,123 employees (8,623 FTEs) in December, led by Federal Express (up 12,945).
The December industry-wide numbers include 619,941 full-time and 108,209 part-time workers, an increase from November of 9,820 full-time workers and 10,229 part-time workers. As of December, the U.S. airline industry was operating with 25,232 fewer employees (3.3%) than at the mid-February 2020 onset of the COVID-19 pandemic.
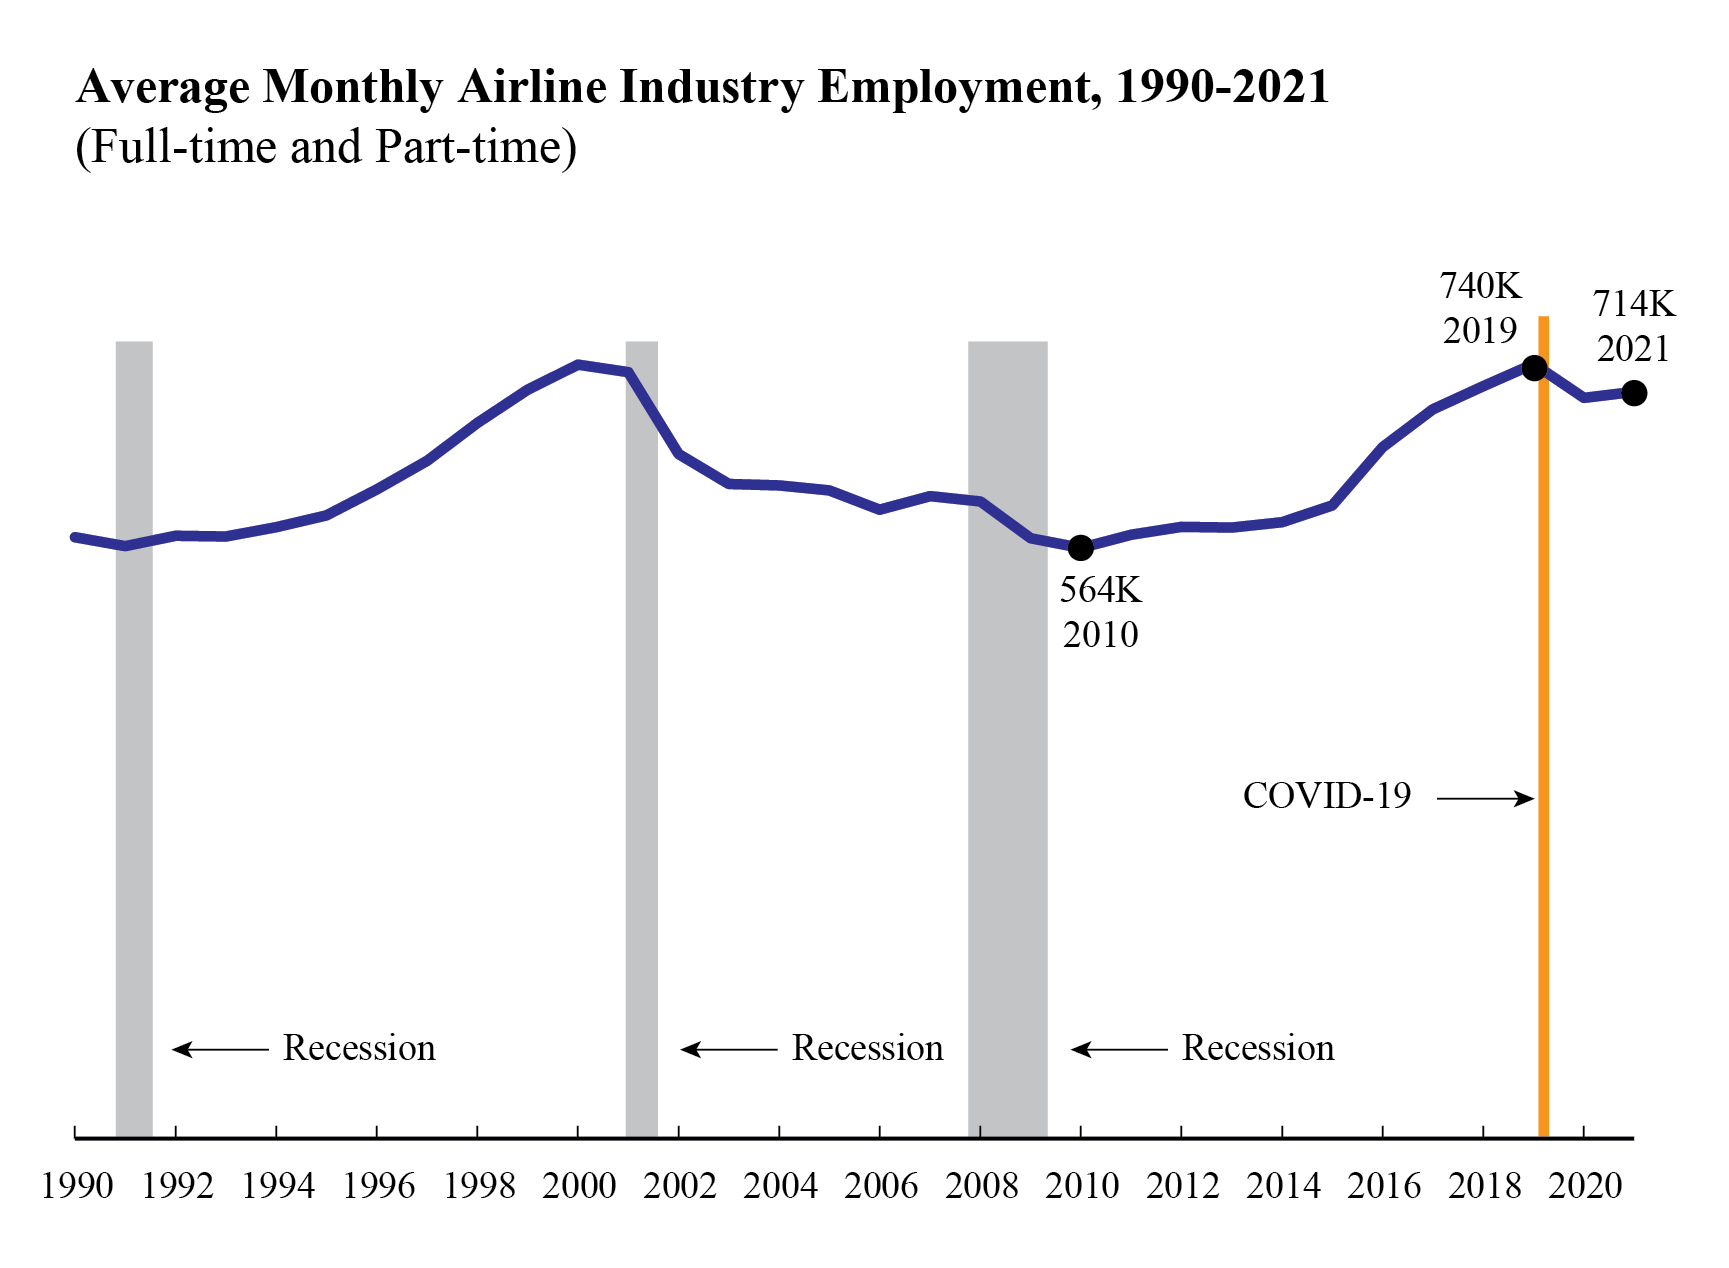
For the calendar year 2021, average monthly U.S. airline industry employment was 713,804, up 0.83% from 2020 (707,906) and down 3.53% from 2019 (740,361). Airlines receiving payroll support from the 2020 Coronavirus Aid, Relief and Economic Security Act (CARES Act) were prevented from furloughing employees until October 1, 2020.
Total employment (full-time + part-time) by U.S. airlines (passenger + cargo carriers):
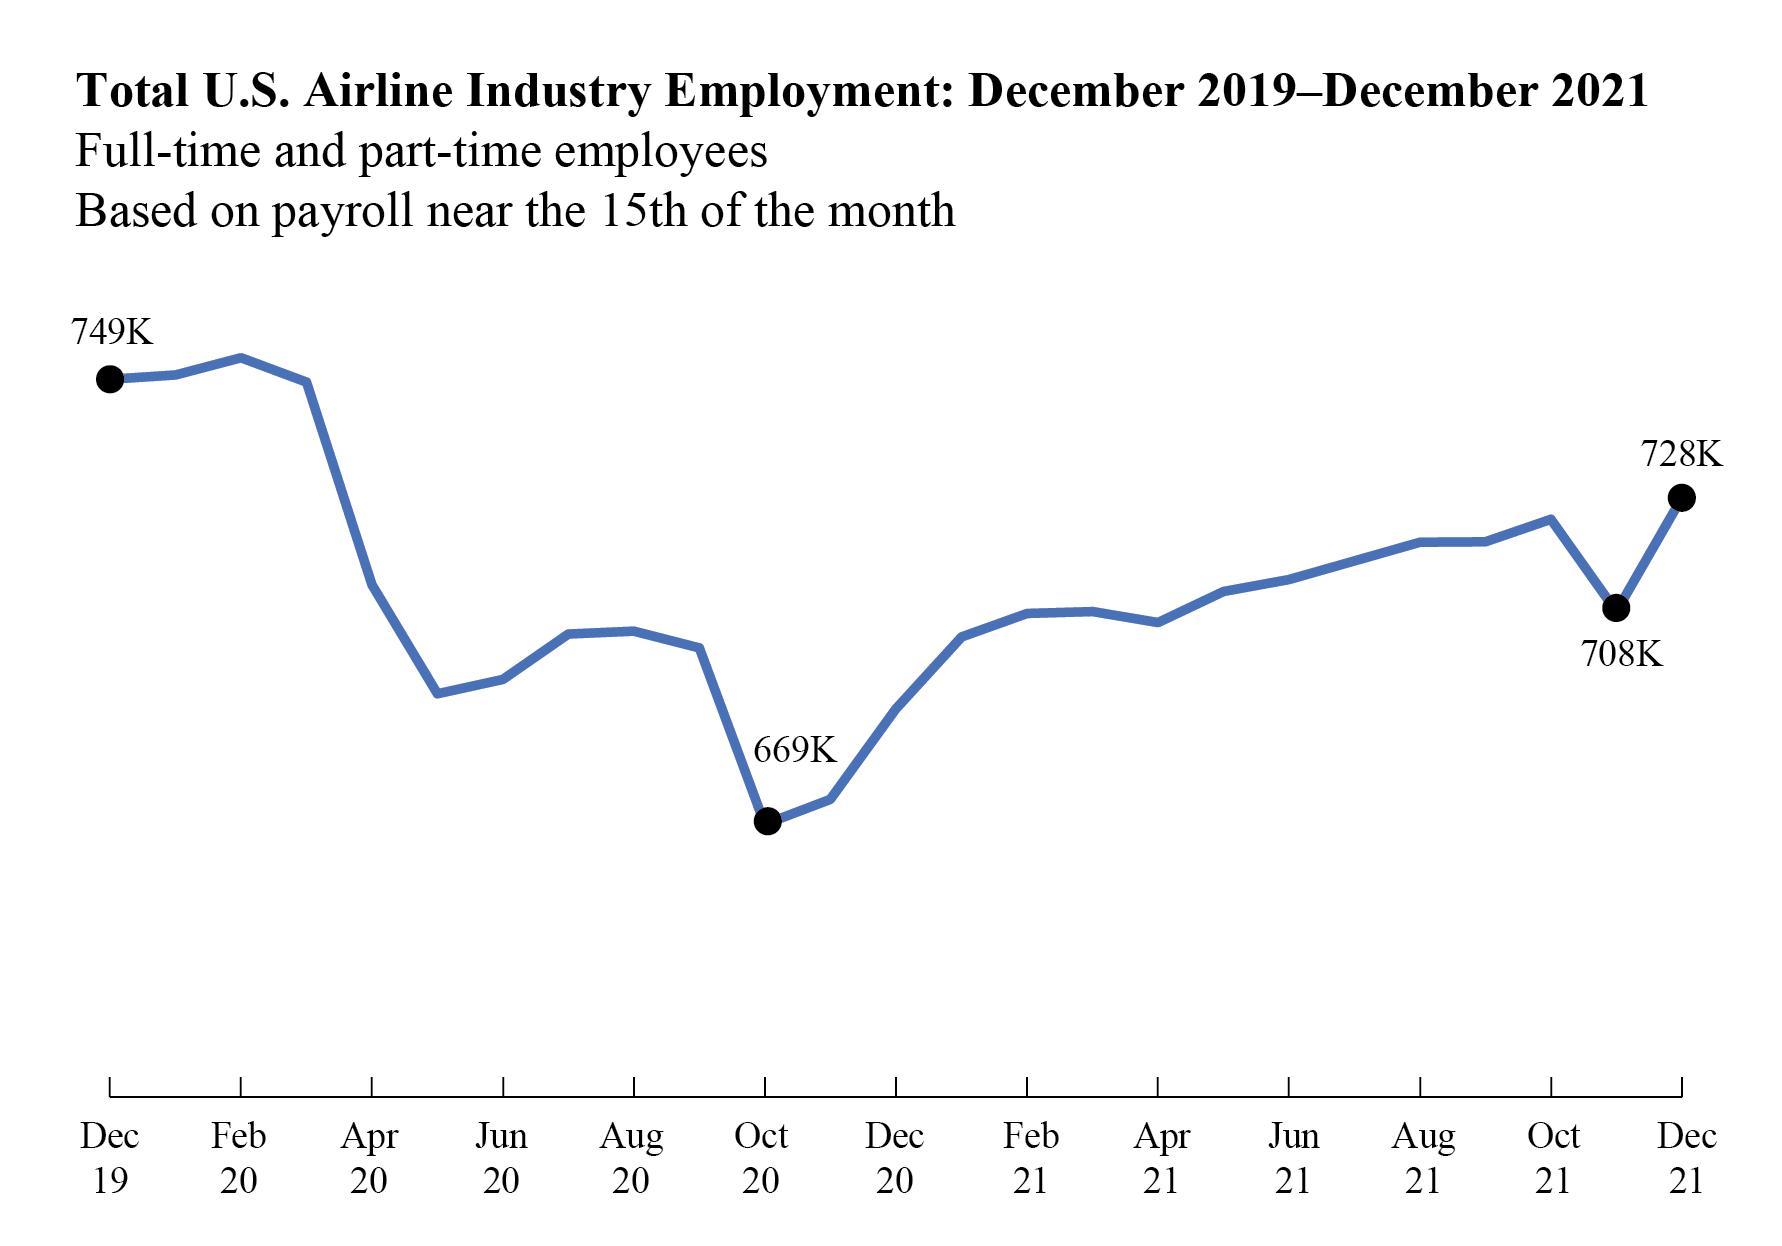
December 2019: 749,490
February 2020 (COVID-19 onset): 753,382
October 2020 (pandemic low point): 669,172
November 2021: 708,101 (revised)
December 2021 (pandemic high point): 728,150
U.S. Scheduled Passenger Airlines Full-time Equivalent Employees (FTEs)
BTS calculates FTEs by adding dividing the number of part-time employees by 2 and adding that figure to the number of full-time employees. The 22 U.S. scheduled passenger airlines reporting data for December 2021 employed 421,387 FTEs, 6,312 FTEs (1.5%) more than in November 2021. December’s total number of FTEs remains down 32,276 FTEs (7.1%) from pre-pandemic December 2019’s 452,429 FTEs.
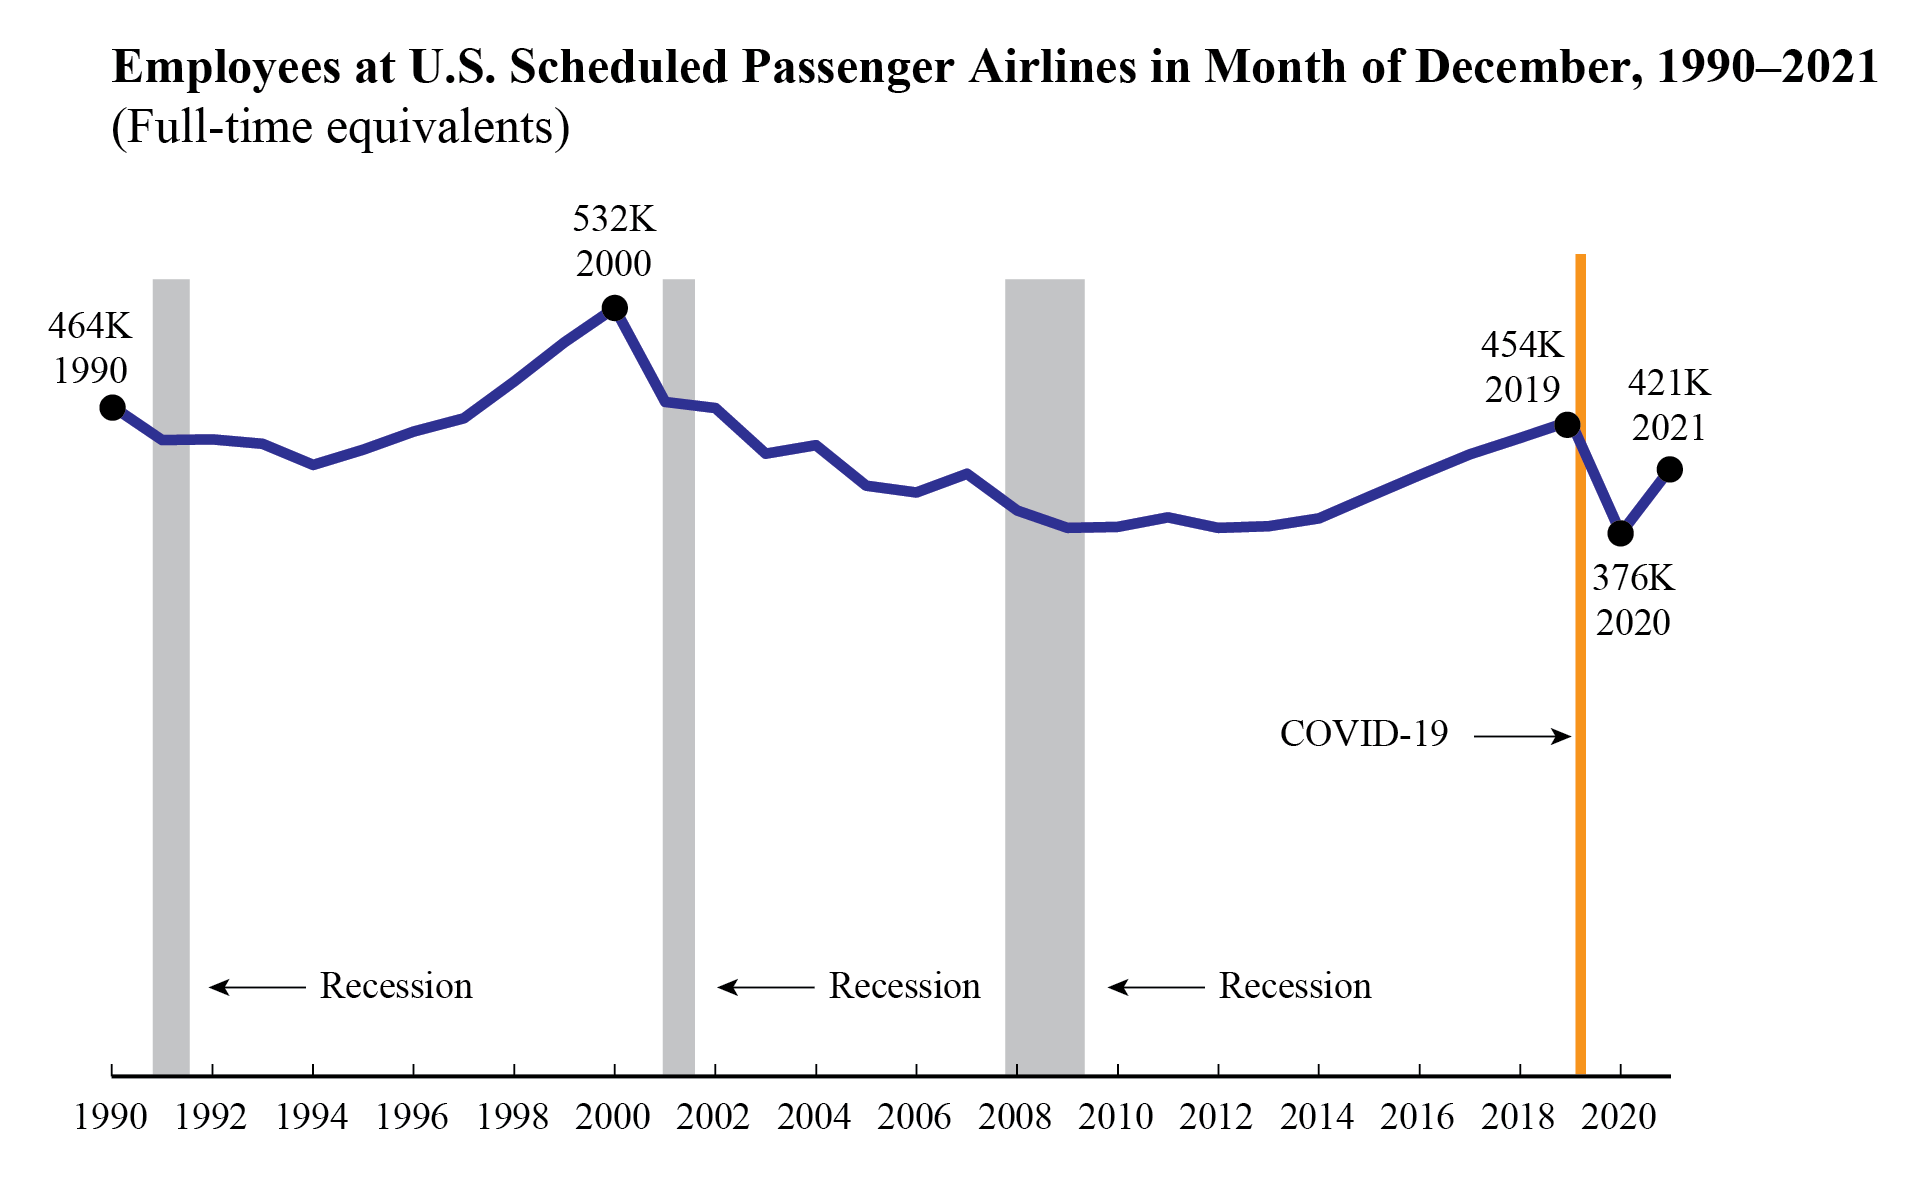
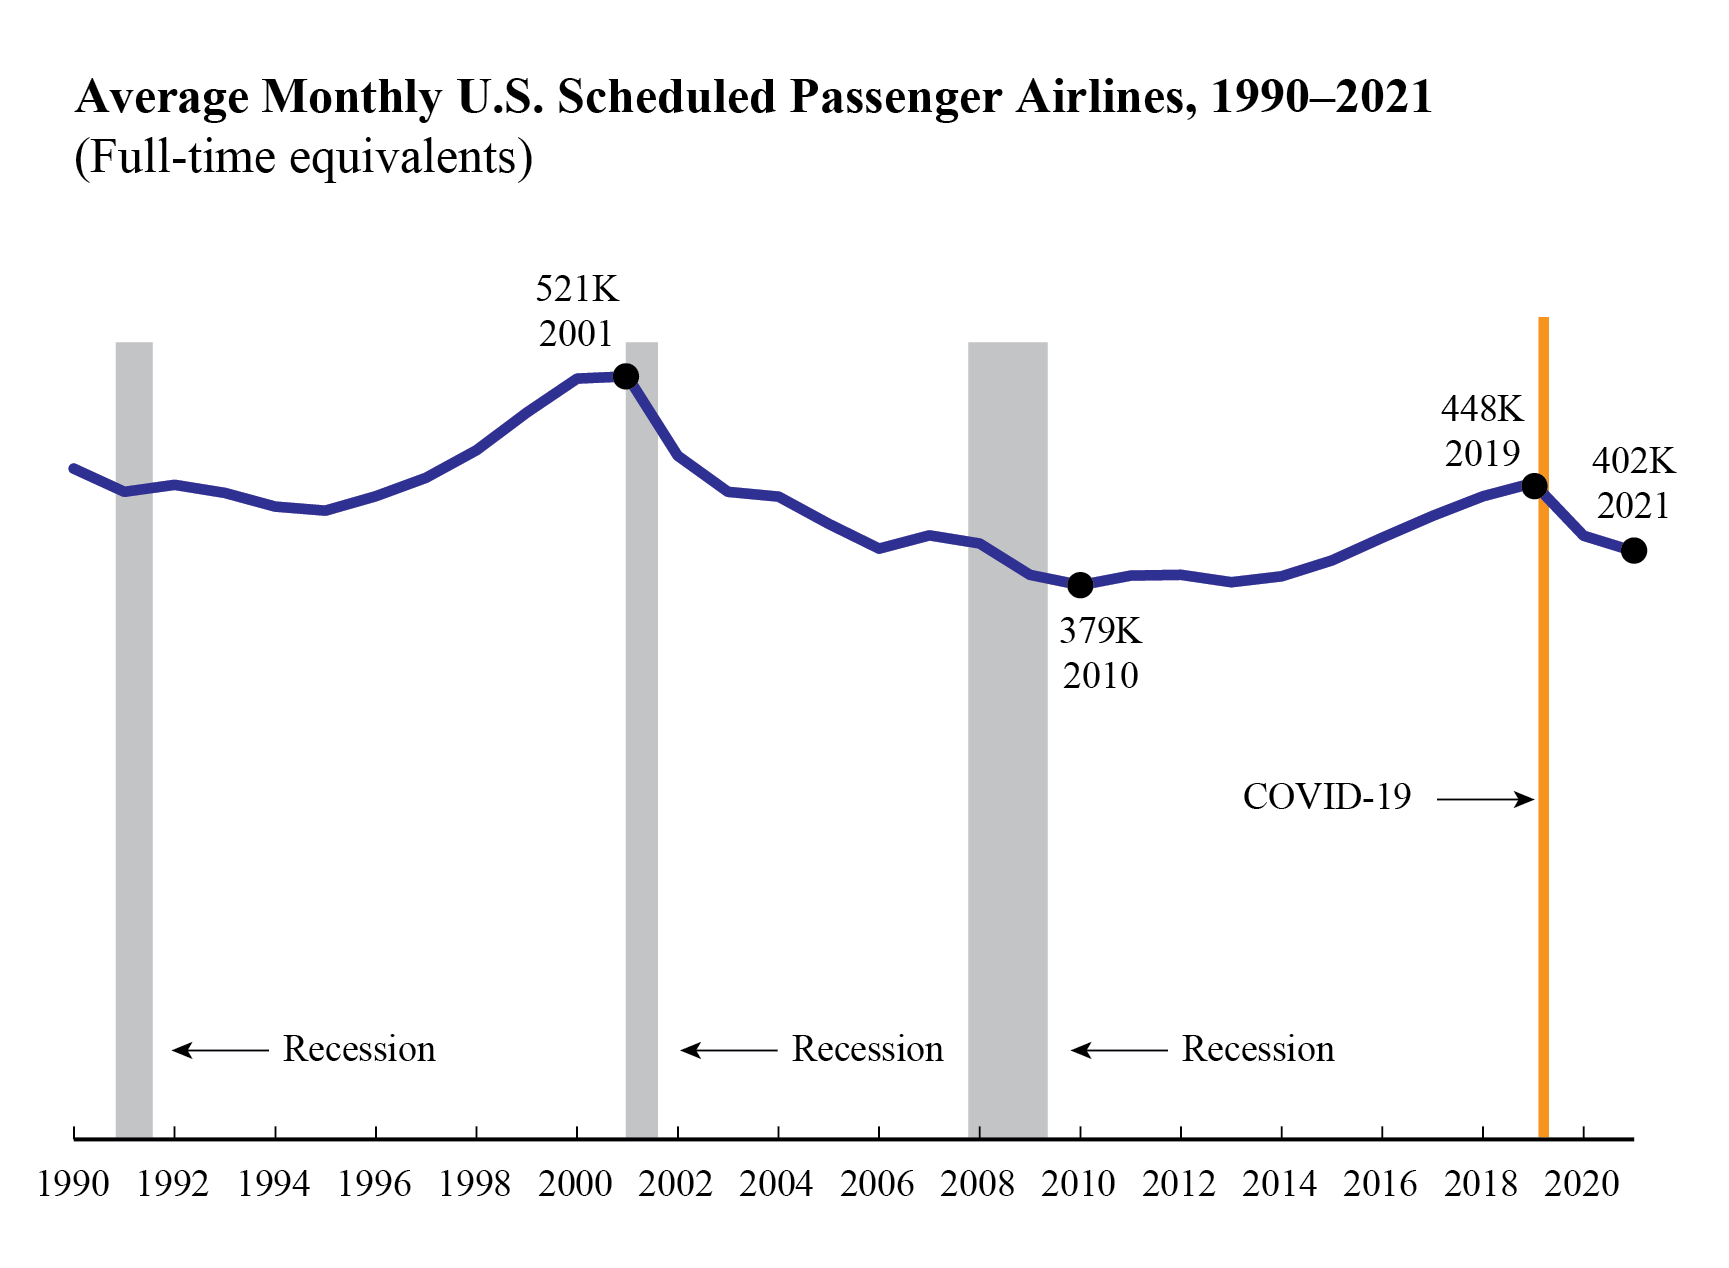
For the calendar year 2021, U.S. scheduled service passenger airlines employed a monthly average of 401,761 FTEs, down 2.6% from the 2020 monthly average and 10.5% from 2021. Airlines receiving payroll support from the 2020 Coronavirus Aid, Relief and Economic Security Act (CARES Act) were prevented from furloughing employees until October 1, 2020.
Four network airlines
American Airlines, Delta Air Lines, United Airlines, Alaska Airlines
- 260,471 FTEs, 61.8% of total scheduled passenger airline FTEs
- Down 9.9% (28,688 FTEs) from December 2019 (289,159 FTEs)
- Up 13.8% (31,622 FTEs) from December 2020 (228,849 FTEs)
- Up 2.2% (5,723 FTEs) from November 2021 (254,748) FTEs
Network airlines operate a significant portion of their flights using at least one hub where connections are made for flights to down-line destinations or spoke cities. Note that beginning with January 2018 data, Virgin America’s numbers are included with Alaska Airlines in the network category.
Five low-cost airlines
Southwest Airlines, JetBlue Airways, Spirit Airlines, Frontier Airlines, Allegiant Air
- 93,784 FTEs, 22.3% of total scheduled passenger airline FTEs
- Down 4.0% (3,929 FTEs) from December 2019 (97,713 FTEs)
- Up 2.3% (2,121 FTEs) from December 2020 (91,663 FTEs)
- Up 1.3% (1,170 FTEs) from November 2021 (92,614) FTEs
Low-cost airlines operate under a low-cost business model, with infrastructure and aircraft operating costs below the overall industry average.
Ten regional airlines
SkyWest Airlines, Envoy Air, Piedmont Airlines, Republic Airlines, Endeavor Air, PSA Airlines, Horizon Air, Mesa Airlines, Air Wisconsin Airlines, GoJet Airlines
- 58,577 FTEs, 13.9% of total scheduled passenger airline FTEs
- Up 0.1% (57 FTEs) from December 2019 (58,520 FTEs)
- Up 21.8% (10,481 FTEs) from December 2020 (48,096 FTEs)
- Down 0.7% (427 FTEs) from November 2021 (59,004 FTEs)
Regional carriers typically provide service from small cities, using primarily regional jets to support the network carriers’ hub and spoke systems.
Top Employers by Group
- Network: American 92,103 FTEs
- Low-Cost: Southwest 55,093 FTEs
- Regional: SkyWest 14,382 FTEs
Three other airlines included in industry totals
Other carriers generally operate within specific niche markets. They are Hawaiian Airlines, Sun Country Airlines, and Silver Airlines.
Reporting Notes
Data are compiled from monthly reports filed with BTS by commercial air carriers as of February 3, 2022. Additional airline employment data and previous releases can be found on the BTS website.
Passenger, cargo, and charter airlines that operate at least one aircraft that has more than 60 seats or the capacity to carry a payload of passengers, cargo, and fuel weighing more than 18,000 pounds must report monthly employment statistics. Regulations require U.S. airlines to report employment numbers for employees who worked or received pay for any part of the pay period(s) ending nearest the 15th day of the month.
See the tables that accompany this release on the BTS website for detailed data since 2015 (Tables 1-15) and industry summary monthly data since 1990. Additional individual airline numbers are available on the BTS airline employment web page. The web page provides full-time and part-time employment numbers by carrier by month from 1990 through December 2021.
The next update for U.S. airline employment is scheduled for March 8.
Tags: US DOT