
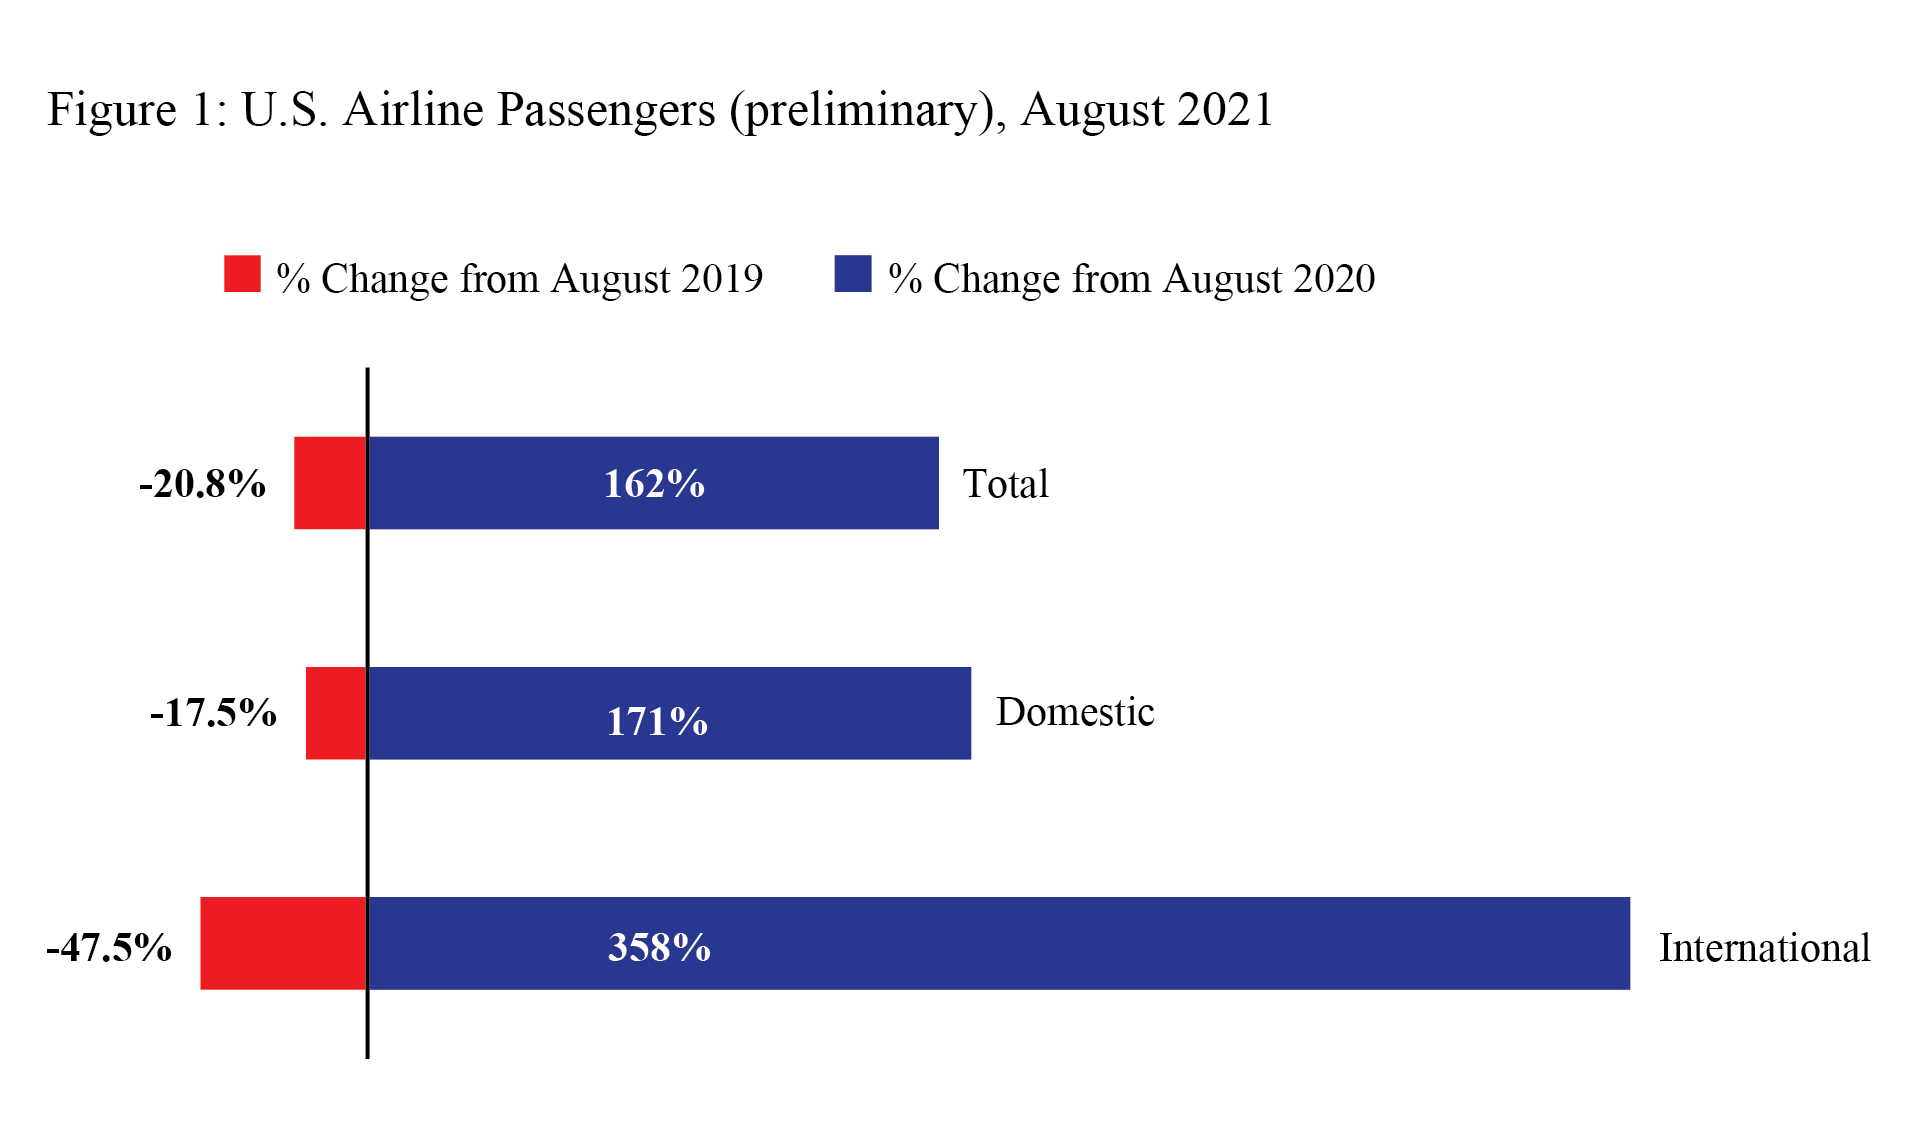
Preliminary August 2021 passenger numbers (20 carriers reporting):
- Total: 66 million passengers, up 162% from August 2020 (25.2M), down 20.8% from August 2019 (83.4M)
- Domestic: 59.7 million passengers, up 151% from August 2020 (23.8M), down 17.5% from August 2019 (72.4M)
- International: 6.3 million passengers, up 358% from August 2020 (1.4M), down 42.7% from August 2019 (11M)
U.S. airline traffic reports are filed monthly with BTS. Final August data will be released on Nov 12. Complete international data by origin and destination, which is under a six-month confidentiality restriction, will be released in Feb 2022.
Systemwide Passengers
- August 2021 passengers: 66M
- Change from August 2020: 162%
- Change from August 2019: -20.8%
- Percent of 2020 passengers: 262%
- Change from April 2020 COVID-19 low: +63M passengers
Table 1: Systemwide Percent Change in US Airlines Scheduled Service Passengers from the Same Month of the Previous Year, 2017-2021
Year-to-Year Percent Change | ||||
| 2017 - 2018 | 2018 - 2019 | 2019 - 2020 | 2020 - 2021 |
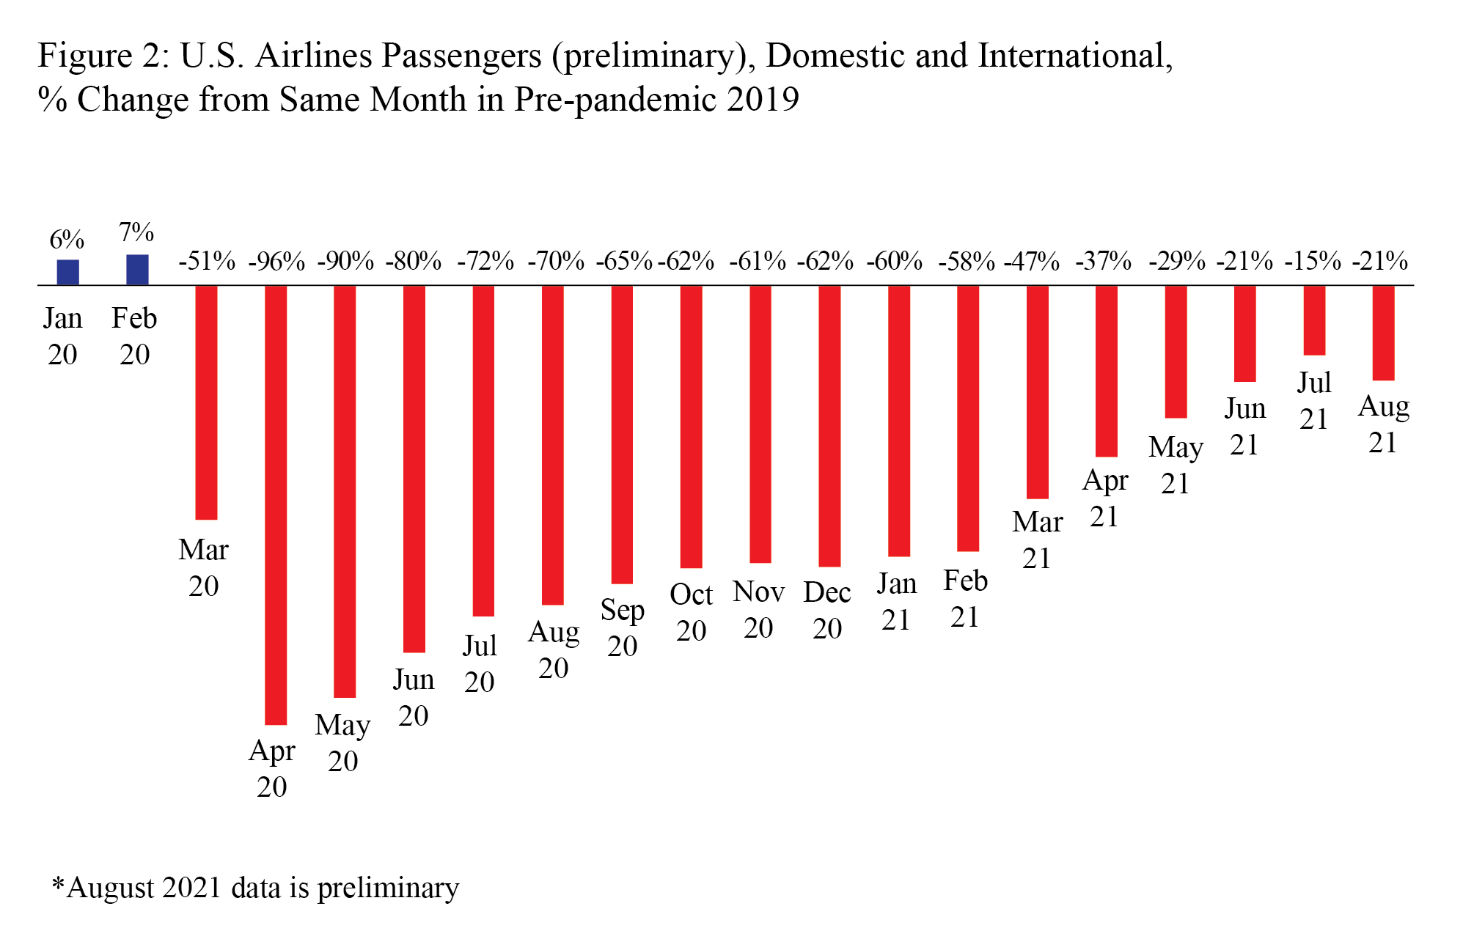
January | 3.0 | 5.2 | 5.7 | -61.5 |
February | 5.8 | 4.2 | 6.7 | -60.8 |
March | 4.6 | 6.4 | -51.3 | 9.5 |
April | 6.0 | 3.9 | -96.1 | 1492.3 |
May | 6.1 | 5.3 | -90.1 | 617.3 |
June | 6.2 | 3.7 | -80.3 | 300.3 |
July | 6.4 | 3.7 | -72.4 | 206.7 |
August | 6.3 | 3.5 | -69.8 | 162.3* |
September | 7.1 | 5.7 | -65.2 |
|
October | 5.0 | 4.2 | -61.8 |
|
November | 5.7 | 0.5 | -60.7 | |
December | 4.8 | 8.9 | -61.5 | |
Jan - Aug | 5.6 | 4.4 | -59.1 | 60.4 |
Annual | 5.6 | 4.6 | -60.2 |
|
Source: Bureau of Transportation Statistics, T-100 Market
*August 2021 data is preliminary
Domestic Passengers
- August 2021 passengers: 59.7M
- Change from August 2020: 151%
- Change from August 2019: -17.5%
- Percent of 2020 passengers: 251%
- Change from April 2020 low: +56.9M passengers
- Domestic percent of total August 2021 passengers: 90%
- Domestic percent of total August 2020 passengers: 95%
Table 2: Domestic Percent Change in US Airlines Scheduled Service Passengers from the Same Month of the Previous Year, 2017-2021
Year-to-Year Percent Change | ||||
| 2017 - 2018 | 2018 - 2019 | 2019 - 2020 | 2020 - 2021 |
January | 3.3 | 5.3 | 6.2 | -60.6 |
February | 6.0 | 4.2 | 7.5 | -59.1 |
March | 4.2 | 6.7 | -51.0 | 14.3 |
April | 7.0 | 3.8 | -95.7 | 1426.5 |
May | 6.6 | 5.3 | -89.0 | 571.6 |
June | 6.6 | 3.6 | -77.9 | 272.8 |
July | 7.2 | 3.9 | -69.6 | 191.1 |
August | 6.9 | 3.5 | -67.1 | 151* |
September | 7.2 | 5.9 | -62.7 | |
October | 5.0 | 4.3 | -59.9 | |
November | 5.8 | 0.3 | -59.4 | |
December | 5.0 | 9.6 | -60.9 | |
Jan - Aug | 6.0 | 4.5 | -57.7 | 61.8 |
Annual | 5.9 | 4.6 | -58.7 |
|
Source: Bureau of Transportation Statistics, T-100 Domestic Market
*August 2021 data is preliminary
International Passengers
- August 2021 passengers: 6.3M
- Change from August 2020: 358%
- Change from August 2019: -42.7%
- Percent of 2020 passengers: 458%
- Change from April 2020 low: +6.2M passengers
- International percent of total August 2021 passengers: 10%
- International percent of total August 2020 passengers: 5%
Table 3: International Percent Change in US Airlines Scheduled Service Passengers from the Same Month of the Previous Year, 2017-2021
Year-to-Year Percent Change | ||||
| 2017 - 2018 | 2018 - 2019 | 2019 - 2020 | 2020 - 2021 |
January | 1.3 | 4.8 | 2.1 | -67.5 |
February | 4.8 | 3.8 | 1.0 | -73.4 |
March | 7.4 | 3.8 | -53.3 | -25.7 |
April | -0.6 | 4.7 | -98.6 | 2923.3 |
May | 2.7 | 5.7 | -98.1 | 2530 |
June | 3.7 | 4.3 | -96.4 | 1414.6 |
July | 1.9 | 2.3 | -90.4 | 525.8 |
August | 2.5 | 3.9 | -87.5 | 357.7* |
September | 6.3 | 4.7 | -83.7 | |
October | 4.6 | 3.4 | -77.3 | |
November | 5.0 | 2.4 | -70.3 | |
December | 3.6 | 4.0 | -66.0 | |
Jan - Aug | 2.9 | 4.1 | -68.7 | 47.7 |
Annual | 3.5 | 4.0 | -70.4 |
|
Source: Bureau of Transportation Statistics, T-100 International Market
*August 2021 data is preliminary
Reporting Notes
Data are compiled from monthly reports filed with BTS by commercial U.S. air carriers detailing operations, passenger traffic and freight traffic. This release includes data received by BTS from U.S. airlines as of October 7, 2021.
See the BTS Airlines and Airport page for additional U.S. airlines numbers through July 2021 for U.S. airlines. International data by origin and destination is available through April 2021.
None of the data above are from samples. Measures of statistical significance do not apply to the complete air traffic data.