The National Travel and Tourism Office (NTTO) has completed posting of the 2017 states, cities, regions visited by overseas travelers and profiles to the website on the Inbound Travel to the U.S. page.
NTTO's page contains 24 country profiles, 10 regional profiles and eight sector/activity profiles for 2017, containing characteristics based on SIAT passenger responses and visitor spending reports.
The ‘profile’ format and content have been totally redesigned. We have moved from a static PDF format with year-over-year only data to an Excel format spanning over 20-years of data! Note: the Excel sheet can be opened-up (unhide hidden columns) to span the 1997 - 2017 period. Example:
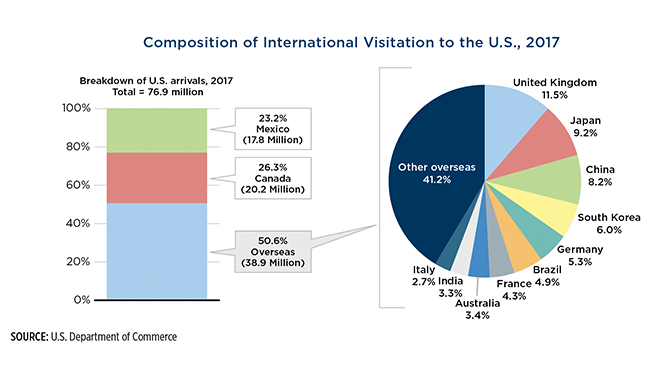
Refer to the ‘Overseas’ profile, row 51 contains ‘Total Arrivals (000)’ as reported by DHS I-94s.

Question: How has the convention/conference/trade show segment performed over time? Row 251 contains the % share of arrivals.
Multiply Total Arrivals for 2000 (25,975,000) x % row 51 (.086) = 2.234 M ...vs.
Multiply Total Arrivals for 2017 (38,906,000) x % row 51 (.085) = 3.307 M, up 48% y-o-y.
With the Excel format the user can calculate a 20-year history and graph the results.
New reports include: The Airline sector report, which profiles overseas air passengers that have indicated use of air transportation within the U.S. during their visit and the Visit American Indian Communities.
Next year’s reports will follow this format but will include a new column for 2018 data.