
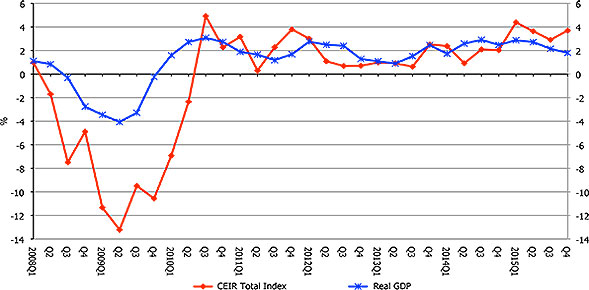
DALLAS – According to the Center for Exhibition Industry Research (CEIR), the business-to-business exhibition industry ended 2015 with a big splash. The performance of the industry, as measured by the CEIR Total Index, posted a strong year-on-year gain of 3.7% in the fourth quarter (see Figure 1). This growth is the second highest rate since the second quarter of 2012. It also marked the 22nd consecutive quarter of year-on-year growth. Over the three years, 2012 through 2014, the exhibition industry growth generally lagged the pace of GDP, but the industry has now outperformed the macro economy for four quarters straight, and by a wide margin (see Figure 2).
“The strong momentum in the exhibition industry could carry forward into 2016 and offset weaker macro factors,” noted CEIR Economist Allen Shaw, Ph.D., Chief Economist for Global Economic Consulting Associates, Inc.
Figure 1: Quarterly CEIR Total Index for the Overall Exhibition Industry, Year-on-Year Growth, 2011Q1-2015Q4
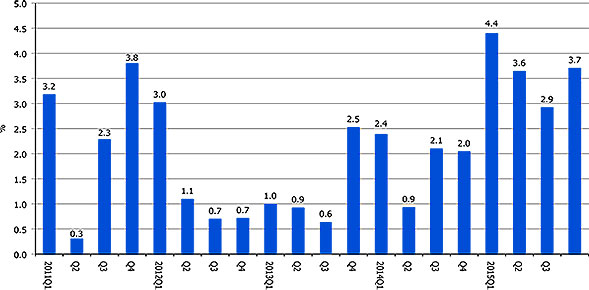
Figure 2: Quarterly CEIR Total Index for the Overall Exhibition Industry vs. Quarterly Real GDP, Year-on-Year Growth, 2008Q1-2015Q4
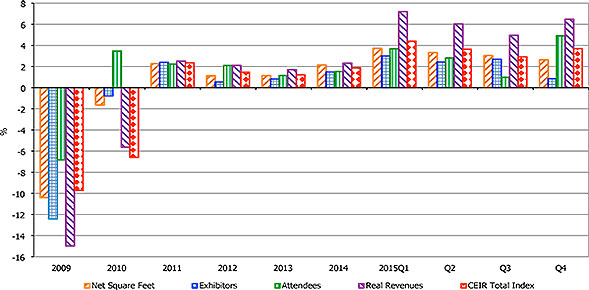
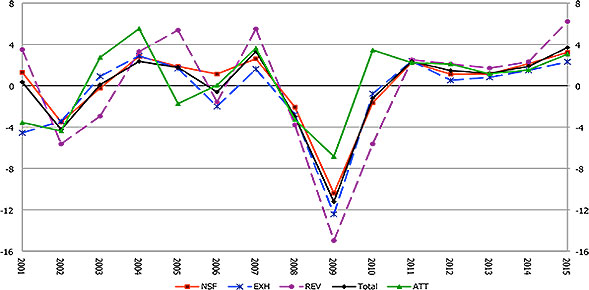
All four exhibition metrics in the fourth quarter posted year-on-year gains. As was the case during the first three quarters of 2015, the strongest metric was Real Revenues (nominal revenues adjusted for inflation) – which rose an impressive 6.5% – followed by Attendees, increasing by 4.9%. Net Square Feet increased 2.6%, and Exhibitors rose 0.9% (see Figures 3 and 4).
Figure 3: Quarterly CEIR Metrics for the Overall Exhibition Industry,Year-on-Year Growth, 2015Q4
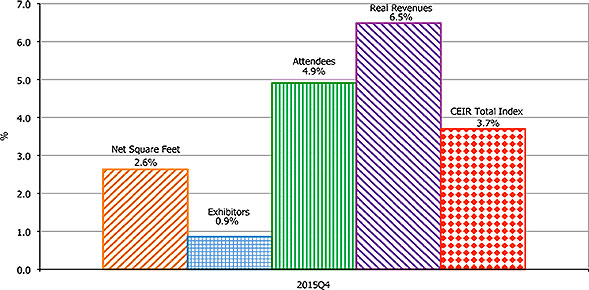
Figure 4: Quarterly CEIR Metrics for the Overall Exhibition Industry, Year-on-Year Growth, 2007-2015Q4
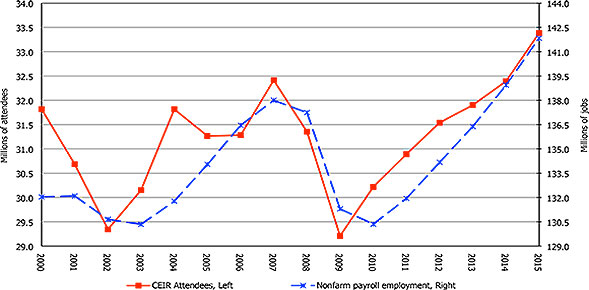
In line with expectations as presented at last year’s CEIR Predict Conference, the Total Index increased by a robust 3.7% for 2015 for the year as a whole, 1.8 percentage points higher than in 2014. Real Revenues had strongest growth among the four metrics, gaining 6.2% from 2014 (see Figure 5). Attendees continued its upward trend since the end of the recession in 2009. In 2015, attendees exceeded its previous peak in 2007, 33.4 million and 32.4 million, respectively. To a large extent, the gains in Attendees during the last few years has been propelled by a strengthening job market (see Figure 6). Since Attendees is a leading indicator of the exhibition industry, good news on attendance bodes well for business in coming years.
Figure 5: Annual CEIR Metrics for the Overall Exhibition Industry,Year-on-Year % Change, 2000-2015
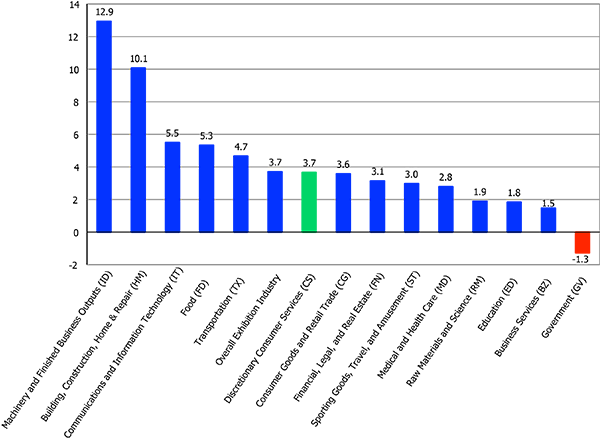
Figure 6: CEIR Attendees vs. Nonfarm Payroll Employment, 2003-2015
The overall exhibition industry’s performance varied by sector. The best performing sectors were (1) Industrial/Heavy Machinery and Finished Business Inputs (ID) and (2) Building, Construction, Home and Repair (HM), which gained 12.9% and 10.1%, respectively (see Figure 7). Both sectors benefited from rebounds in housing construction and robust auto sales. On the other end of the spectrum, the weakest sector was the Government sector, where the index declined by 1.3%. This is hardly a surprise as governments at all levels and functions continued to face tight budgets, especially for training, education and travel.
Figure 7: Ranking of the CEIR Total Index by Sector, Year-on-Year % Change, 2015
“We anticipated 2015 would deliver positive results and yet we were pleasantly surprised that the industry outperformed our original projections,” said CEIR President & CEO Brian Casey, CEM. “While there are varying perspectives on the future performance of the U.S. economy, we remain optimistic for the year ahead. Stay tuned for our full 2015 Index report scheduled for delivery on or around April 1st.”
As an objective measure of the annual performance of the exhibition industry, the CEIR Index measures year-over-year changes in four key metrics to determine overall performance: Net Square Feet of Exhibit Space Sold; Professional Attendance; Number of Exhibiting Companies; and Gross Revenue. The CEIR Index provides data on exhibition industry performance across 14 key industry sectors: Business Services; Consumer Goods; Discretionary Consumer Goods and Services; Education; Food; Financial, Legal and Real Estate; Government; Building, Construction, Home and Repair; Industrial/Heavy Machinery and Finished Business Outputs; Communications and Information Technology; Medical and Health Care; Raw Materials and Science; Sporting Goods, Travel and Entertainment; and Transportation.